Overview
We live in a world of data. You engage with data when you publish on Facebook or LinkedIn. You engage with data when you leave a comment on a friend's post or like their photos or comments. Every day, we generate and use data. By sharing content, like photographs, and leaving comments, you generate data that is used to analyze patterns in your behavior and of course your buying habits. Have you ever observed that, occasionally, when you click on something online, it appears to be following you across several web pages or websites? That is an example of Data and analytics
Microsoft Excel is a powerful tool for Data Analytics and the built-in pivot tables are arguably the most popular analytic tool that allows you to analyze data easily.
Course objectives
By the end of this course, you'll be able to:
Excel Basic
Excel functions and Formula
Pivot tables
Pivot chart
Data visualization
Data transformation
Data Modeling
Reprting in Excel
Course benefits
Enrollment close

Course curriculum
1. Module introduction
2. Download course resources
3. Installing Excel
4. Understanding Excel environment
5. Creating income tracker - part 1
6. Creating income tracker - part 2
7. Creating expenses
8. Income and expense tracker corrections
9. Assignment
1. Module Introduction
2. Download resources
3. Working with SUM function
4. Working with AVERAGE function
5. Working with COUNT function
6. Working with IF function
7. Working with Conditional Formatting
8. Working with AUTOSUM function
9. Working with SUMIF function
10. Working with Excel tables
11. Working with table slicer
1. Module introduction
2. Download resources
3. Combining data with VLOOKUP
4. Combining data with XLOOKUP
1. Module introduction
2. Download resources
3. Data Identification
4. Data transformation part 1
5. Data transformation part 2
6. Data transformation part 3
7. Data transformation part 4
8. Data transformation part 5
9. Data transformation part 6
10. Data transformation part 7
11. Close and load data
12. Creating a data model
13. Module review
1. Module introduction
2. Download resources
3. Data identification
4. Loading the data into Excel
5. Merge queries
6. How to Unpivot columns
7. How to pivot data
8. How to work with Fill
9. Close and load data
10. Module review
1. Module introduction
2. Download resources
3. Understanding data modeling
4. Create calendar table part 1
5. Create calendar table part 2
6. Identify matching columns
7. Create table relationships
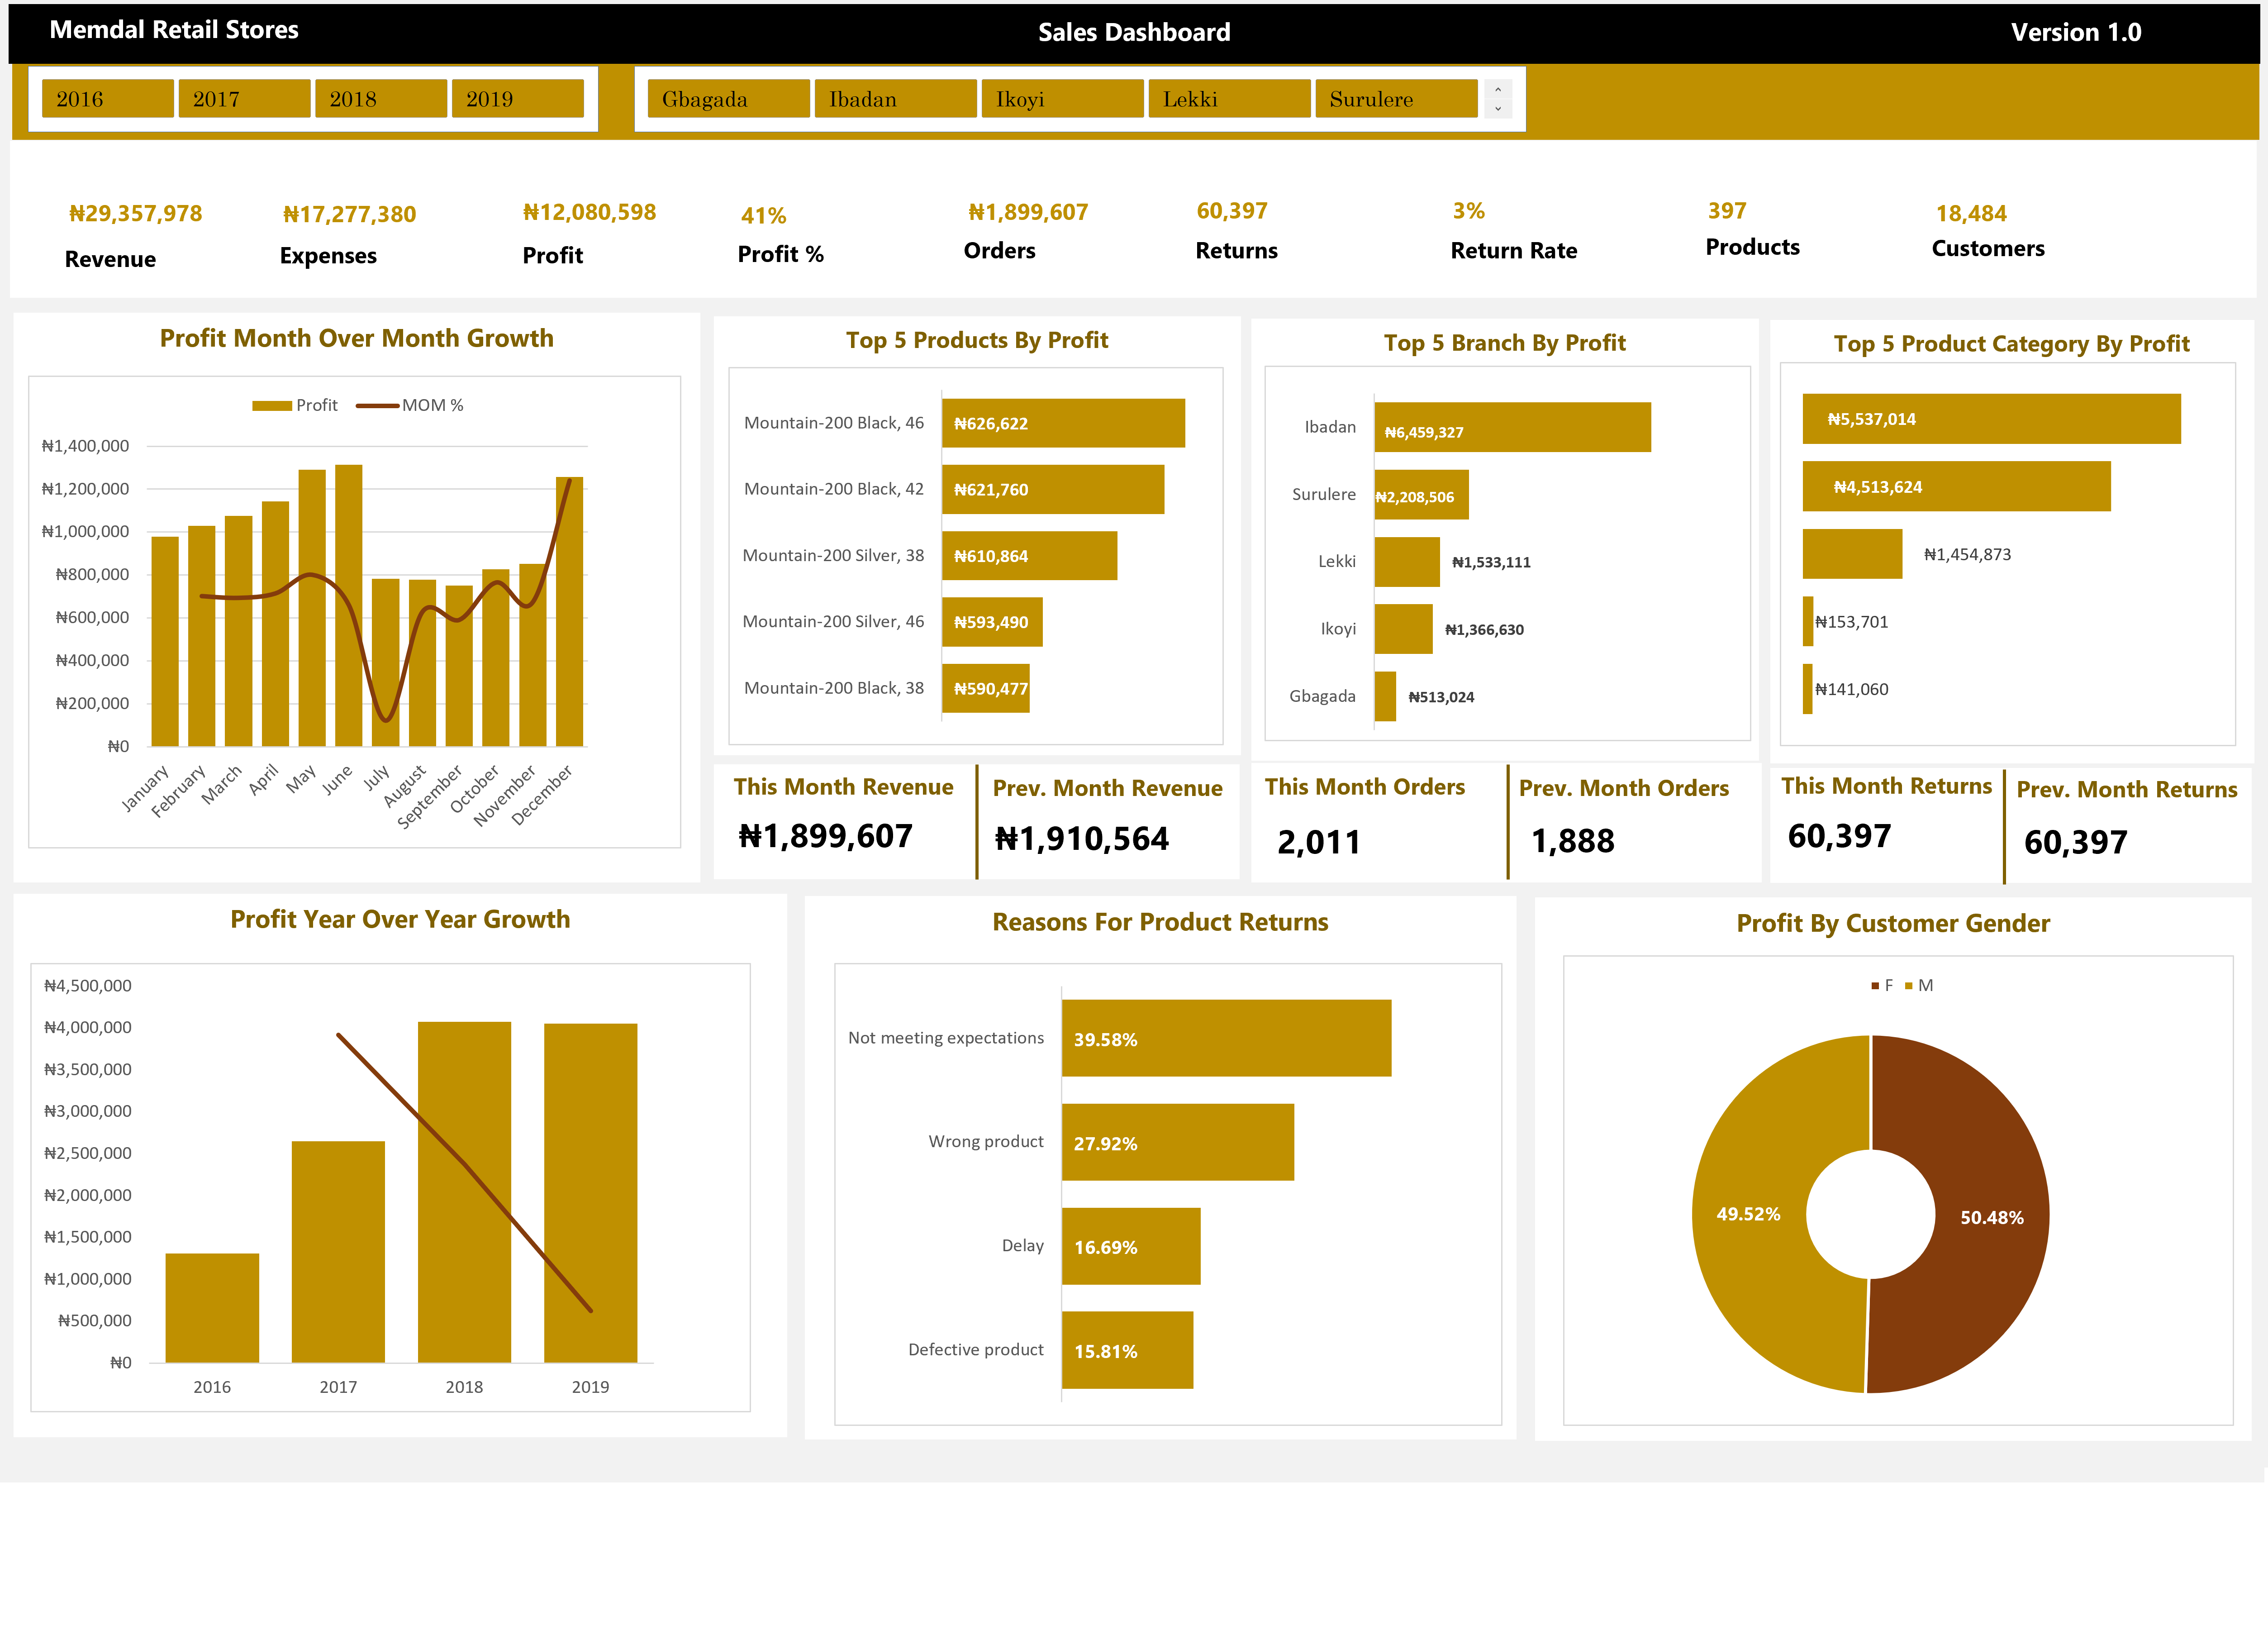
8. Dashboard layout part 1 - Area section
9. Dashboard layout part 2 - Title section
10. Dashboard layout part 3 - Profit MOM section
11. Dashboard layout part 4 - Product profit section
12. Dashboard layout part 5 - Other KPIs section
13. Dashboard layout part 6 - Profit YOY section
14. Dashboard layout part 7 - Add title text
1. Module introduction
2. Download resources
3. Create a revenue calculation
4. Link Revenue calculation to dashboard
5. Create Cost calculation
6. Link Cost calculation to dashboard
7. Create Profit calculation
8. Link Profit calculation to dashboard
9. Create Profit percent calculation
10. Link Profit percent to dashboard
11. Total Orders calculation
12. Link Total Orders to dashboard
13. Total Returns calculation
14. Return Rate calculation
15. Link Return rate to dashboard
16. Products count calculation
17. Link Product count to dashboard
18. Customers count calculation
19. Link Customer count to dashboard
20. Profit MOM growth analysis
21. Profit MOM growth chart
22. Top 5 Products by profit
23. Top 5 Products by profit chart
24. Profit by branch analysis
25. Profit by branch chart
26. Profit by category analysis
27. Profit by category chart
28. This Month Revenue calculation
29. Previous Month Revenue
30. This Month and Pre Month Orders
31. Link This Month and Pre Month Orders to Dashboard
32. This Month and Pre Month Returns
33. Link This Month and Pre Month Returns to Dashboard
34. Profit Year Over Year Analysis
35. YoY Growth chart
36. Reasons for Product Return Analysis
37. Reasons for Product Return Chart
38. Profit by Customer Gender Analysis and Chart
39. Filter the Dashboard by year
40. Filter Dashboard by Branch
41. Filter dashboard by year
42. Save the dashboard
43. Export dashboard as image file


