
Nestle Sales Report - Sales Overview Dashboard (2016-2019)
Project related images. Click to view
Project Overview:
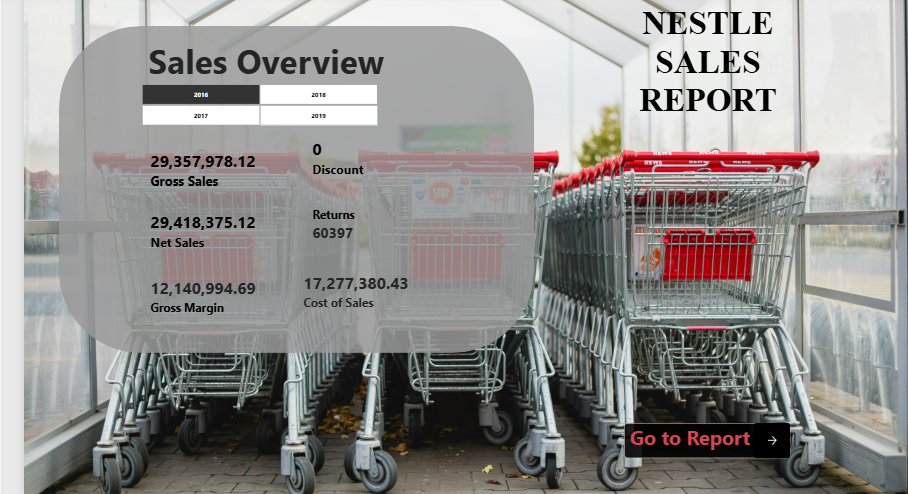
I analyzed 4 years of sales data for Nestle to create a clear executive overview of the company's financial performance. The goal was to move from raw transactional data to key business metrics that show profitability at a glance.
Business Problem:
The client needed a simple, one-page view of overall performance. Management was struggling to track Net Sales and Gross Margin after discounts and returns.
My Role:
Data Analyst (End-to-end project)
Tools: Power BI / PowerPoint for presentation
Insights & Findings:
1. Despite product returns, the business maintained a strong Net Sales of over $29.4M.
2. Gross Margin of $12.1M indicates healthy profitability, covering over 41% of Net Sales.
3. Minimal discounting (0) shows strong pricing strategy, but returns of 60K+ suggests a need to review product quality or delivery process.
Comment (0)
Other projects by Victoria

Talentdigit Resources Limited is a digital training and consulting firm that equips individuals and organizations with digital skills training.


Leave your thought here