
Sales and Revenue Dashboard Report Summary
Project related images. Click to view
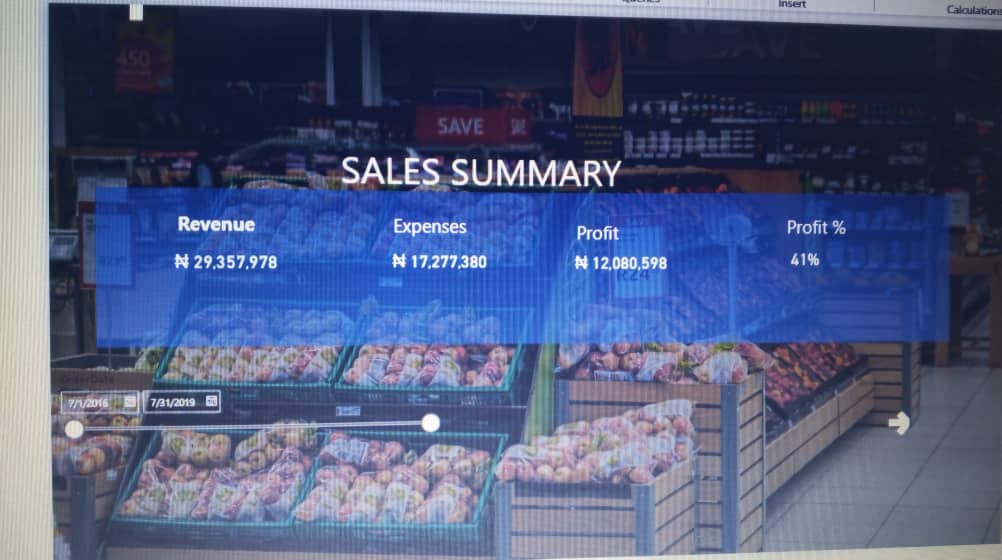
This Power BI dashboard provides a comprehensive analysis of the company's sales performance, revenue, profit, and customer behavior across different time periods, branches, and product categories.
Key Performance Indicators (KPIs)
- Total Revenue: # 29.36 million
-Total Expenses: #17.28 million
- Net Profit: #12.08 million
- Total Order: 27.66k
This show that the company operated at a healthy profit margin, with revenue significantly higher than expenses.
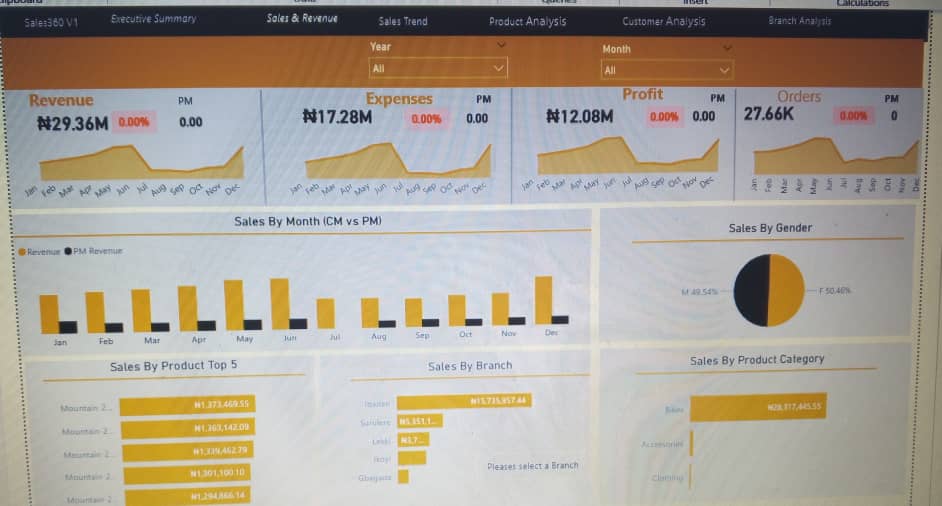
Monthly Revenue Trend
- CM = Current Month (orange bar)
-PM = Previous Month (black bar)
- Revenue was steady from January to June, experienced a drop between July and October, and peaked again in December.
- This could reflect seasonal trends or marketing campaigns boosting year-end performance.
Customer Gender Distribution
- Female customers: 50.46%
-Male customers: 49.54%
- Insight: Sales are evenly distributed by gender, with a slight edge in female purchases.
Top 5 Products by Revenue
All top 5 products are variations of the Mountain 2 line
-Highest-selling product:
#1,373,469.55
Sales by Branch
- Best Preforming branch: Ibadan (#15.73M)
Sales by Product Category
- Bikini: #28.31M -almost all revenue came from this.
-Accessories, Clothing: very small sales in comparison.
Overall Business Insight
- The business is profitable with the strong revenue generation.
-December has the highest sales, showing potential for seasonal promotions.
- there's an opportunity to boost lower-performance branches and product categories.
Comment (0)
Other projects by Usman Zuwairatu

Talentdigit Resources Limited is a digital training and consulting firm that equips individuals and organizations with digital skills training.
Address: 4 Amurie omanze street (off star time junction) Garki 2, Abuja
For Inquiries Call: +234 (0) 7062274671


Leave your thought here