
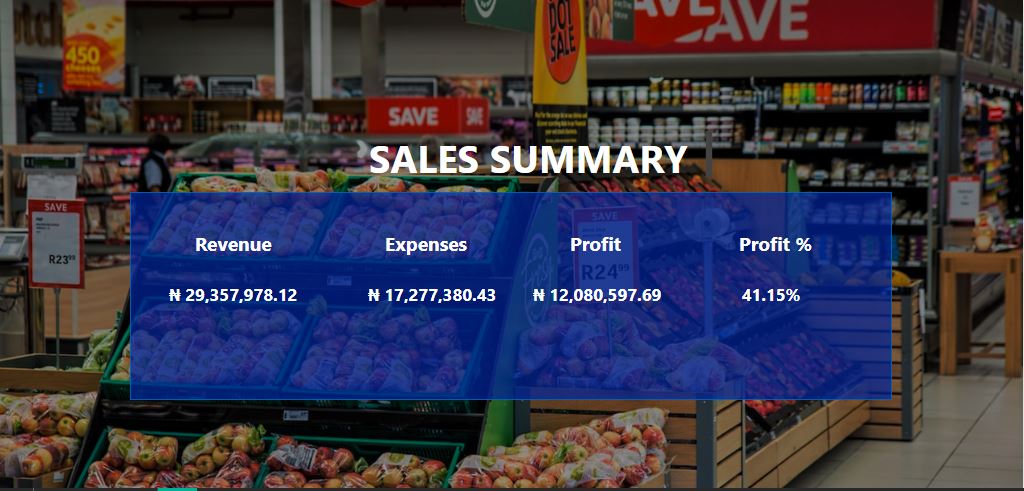
Sales Summary
Project related images. Click to view
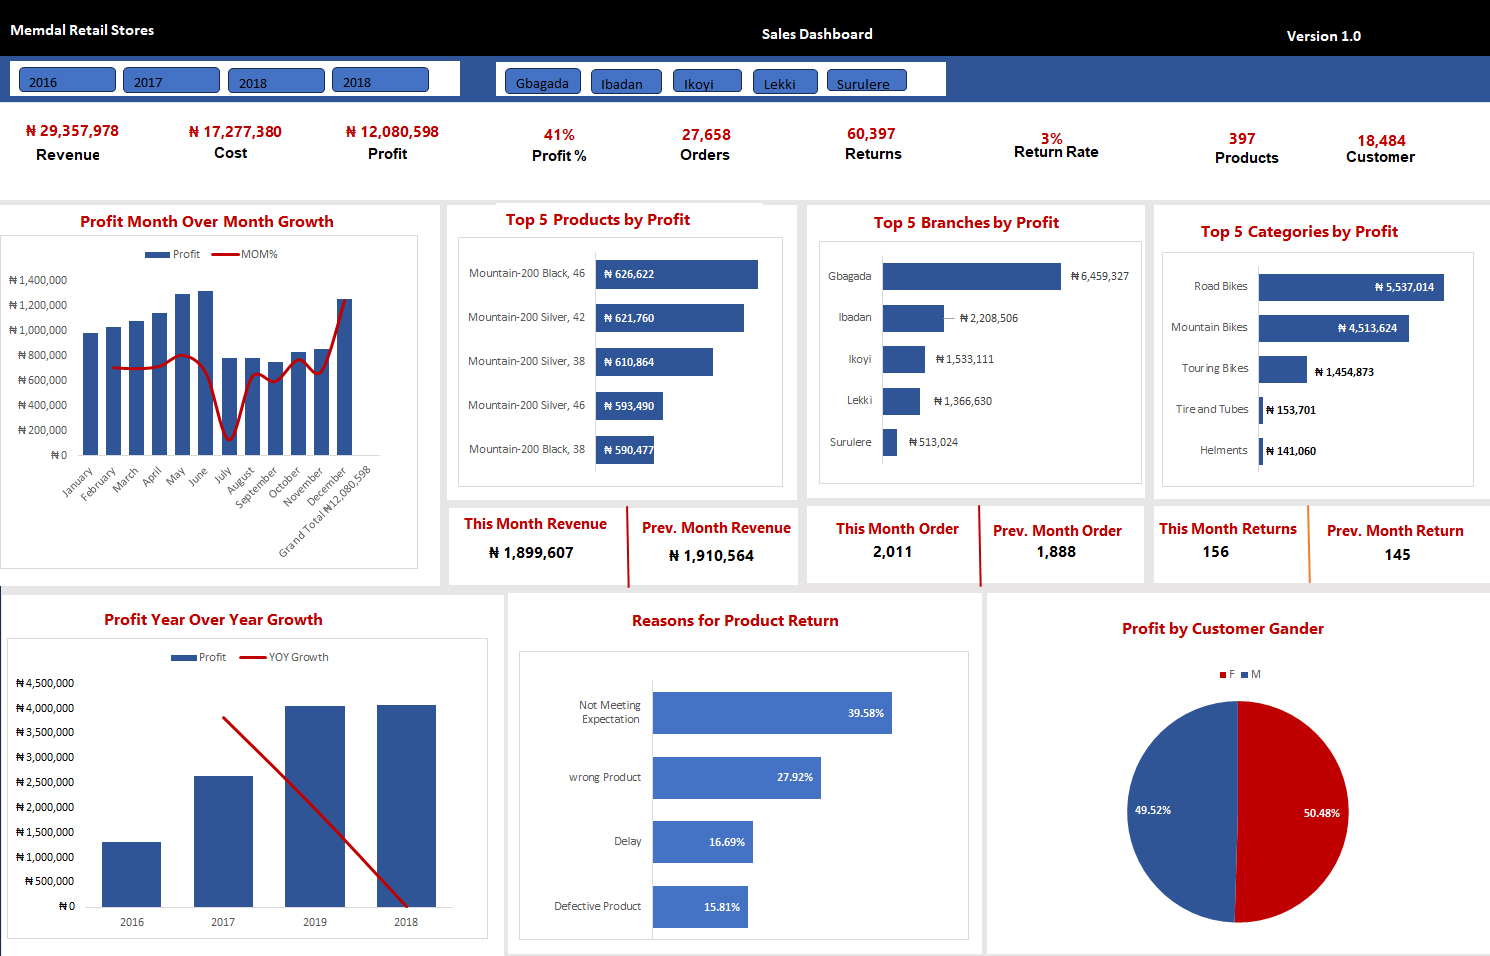
I designed and develop a retail store sales summary Dashboard using Power BI to provide a clear and comprehensive overview of sales performance across multiple stores. The dashboard features key valuables such as line charts for tracking sales trends, bar/column charts for comparing store performance. Additionally, the dashboard include slides for dynamic flittering, enabling users to explore data by store, product and time period. This tool is essential for identifying sales patterns, optimizing store operations, and supporting strategic decision-making.
Comment (0)
Other projects by Samuel
Talentdigit Resources Limited is a digital training and consulting firm that equips individuals and organizations with digital skills training.
Address: 4 Amurie omanze street (off star time junction) Garki 2, Abuja
For Inquiries Call: +234 (0) 7062274671


Leave your thought here