
ABC Stores
Project related images. Click to view
Project Overview
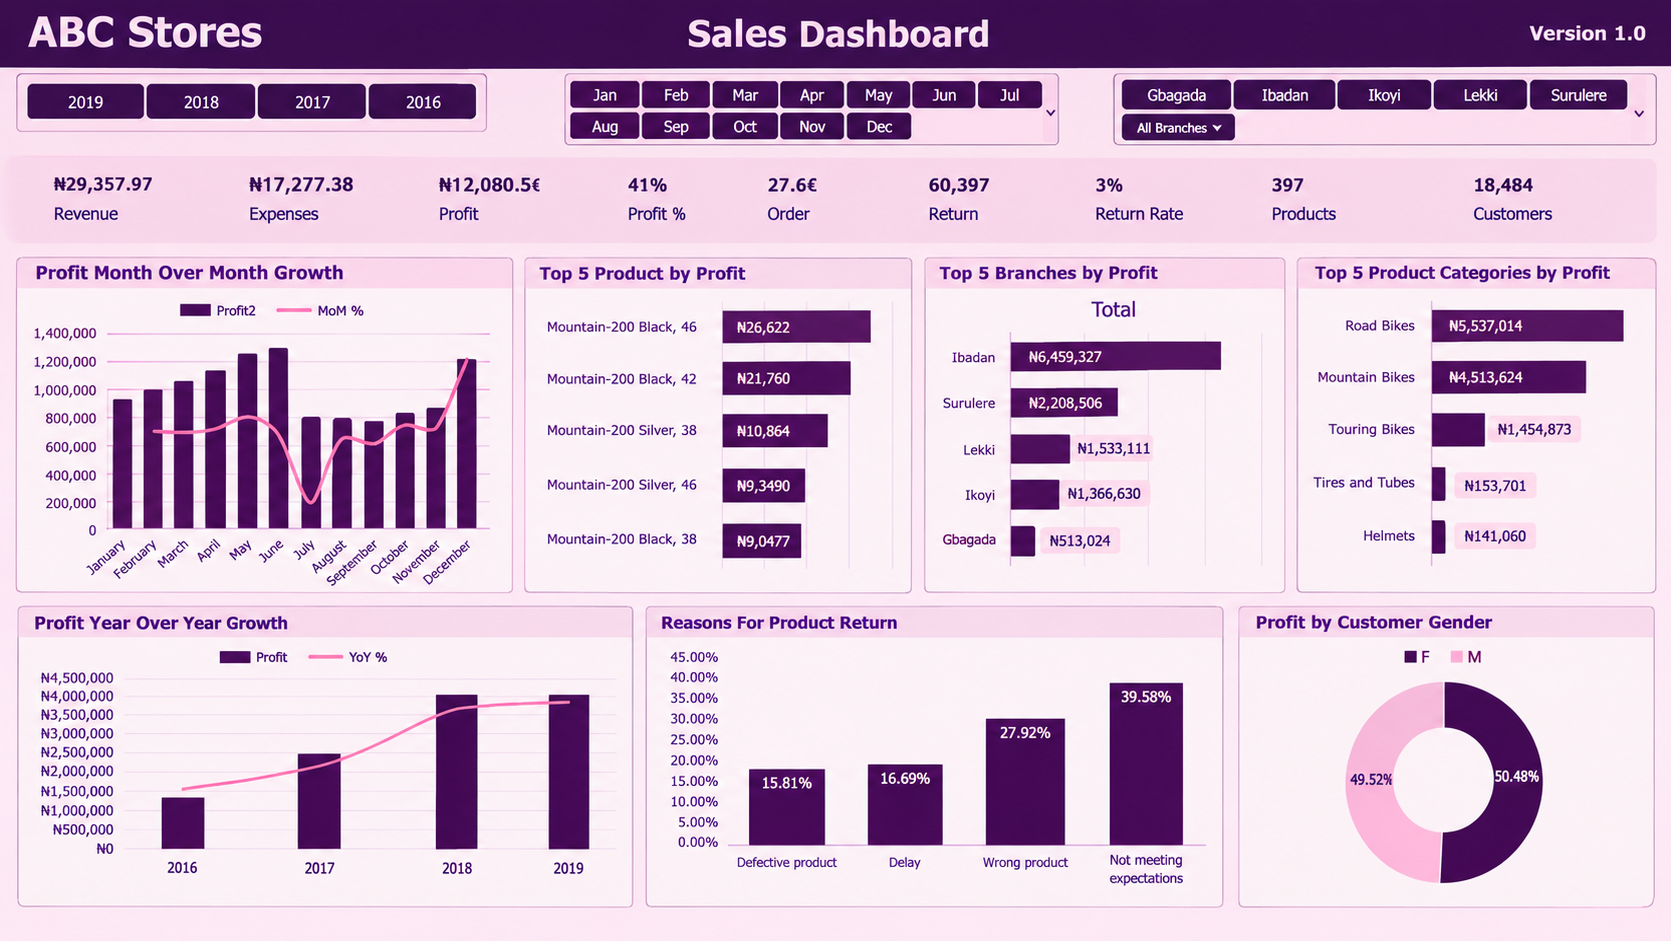
The ABC Stores Sales Dashboard is a data analysis project designed to monitor and evaluate business sales performance from 2016 to 2019. The dashboard provides a visual representation of key business metrics, including revenue, expenses, profit, orders, product returns, and customer demographics
PROJECT OBJECTIVES
Analyze sales revenue, expenses, and profit performance.
Track monthly and yearly profit trends.- Identify top-performing products, branches, and product categories.-
Analyze product return rates and the reasons for returns.-
Use data visualization to support informed business decisions.
KEY INSIGHTS
The dashboard shows that Ibadan recorded the highest profit among the displayed branches, Road Bikes was the most profitable product category, and unmet customer expectations was the leading reason for product returns.Skills DemonstratedData Analysis, Data Visualization, Dashboard Design, KPI Monitoring, Business Intelligence, and Business Reporting.ConclusionThis project demonstrates how sales data can be transformed into meaningful visual insights to evaluate business performance, identify trends, and support strategic decision-making.
Comment (0)
Other projects by Faith

Talentdigit Resources Limited is a digital training and consulting firm that equips individuals and organizations with digital skills training.


Leave your thought here