
LINO Retail Store Sales Summary
Project related images. Click to view
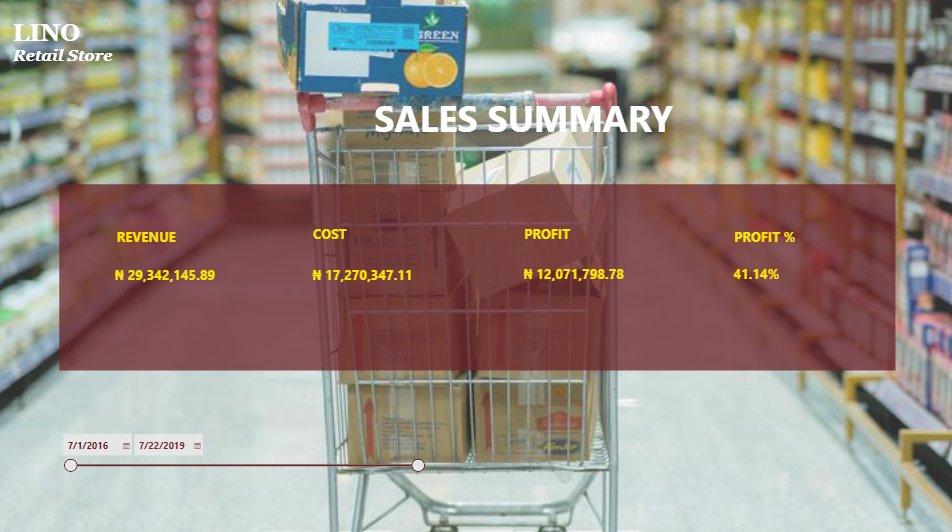
The financial dashboard presents an overview of the organization's financial performance, highlighting revenue generation, operational costs, profitability, and profit margin.
1. Revenue AnalysisThe business generated a total revenue of ?29,342,145.89, representing the total income earned within the reporting period.
2. Cost AnalysisTotal expenditure amounted to ?17,270,347.11, accounting for approximately 58.86% of the total revenue generated.
3. Profitability Analysis the business recorded a net profit of ?12,071,798.78, indicating that revenue exceeded total costs during the reporting period.
4. Profit Margin Analysis
The business achieved a profit margin of 41.14%, meaning that approximately ?41.14 was retained as profit for every ?100 generated in revenue.
Key Insights and Recommendations
The business demonstrates positive financial performance, with revenue significantly exceeding costs.The 41.14% profit margin indicates a healthy level of profitability.Management should continue monitoring operational expenses to maintain or improve profitability.Further analysis of revenue trends and cost distribution would help identify opportunities for sustainable growth.
ConclusionOverall, the financial results indicate a profitable business operation, generating ?12.07 million in profit from ?29.34 million in revenue. Maintaining effective cost management while exploring opportunities to increase revenue could further strengthen the organization's financial position.
Comment (0)
Other projects by Faith

Talentdigit Resources Limited is a digital training and consulting firm that equips individuals and organizations with digital skills training.


Leave your thought here