
ABC Stores Sales Performance Dashboard
Project related images. Click to view
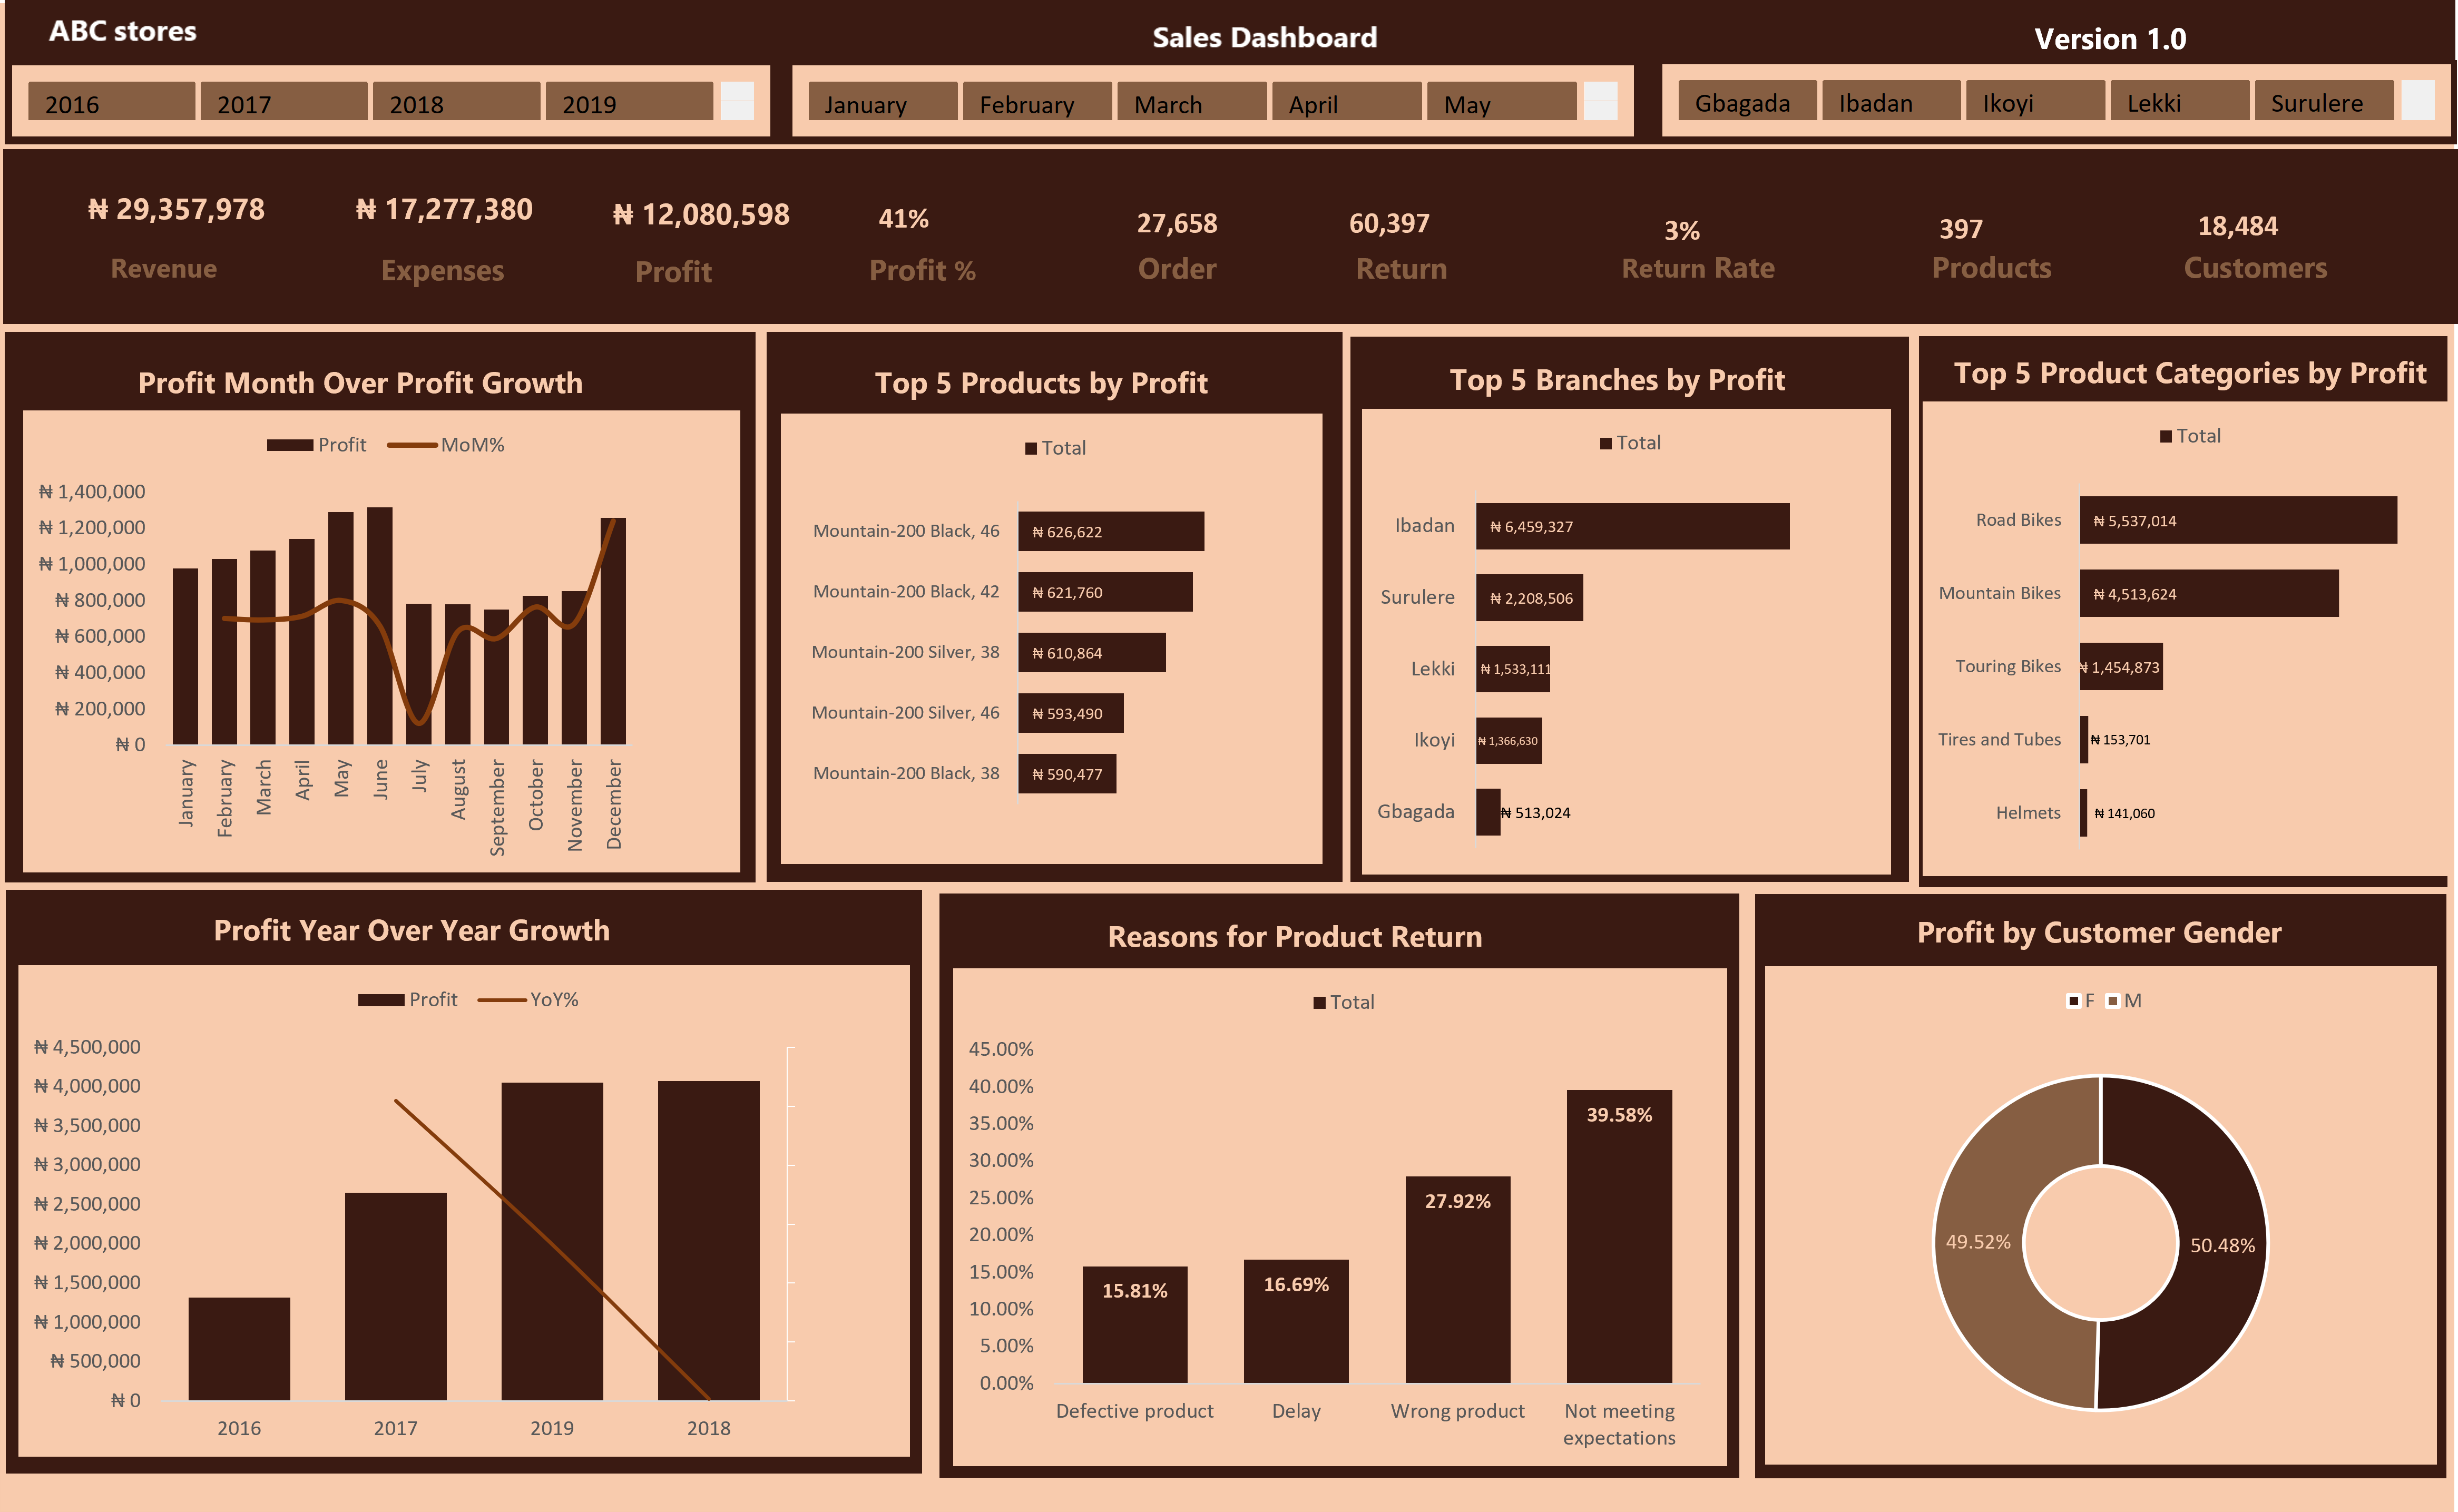
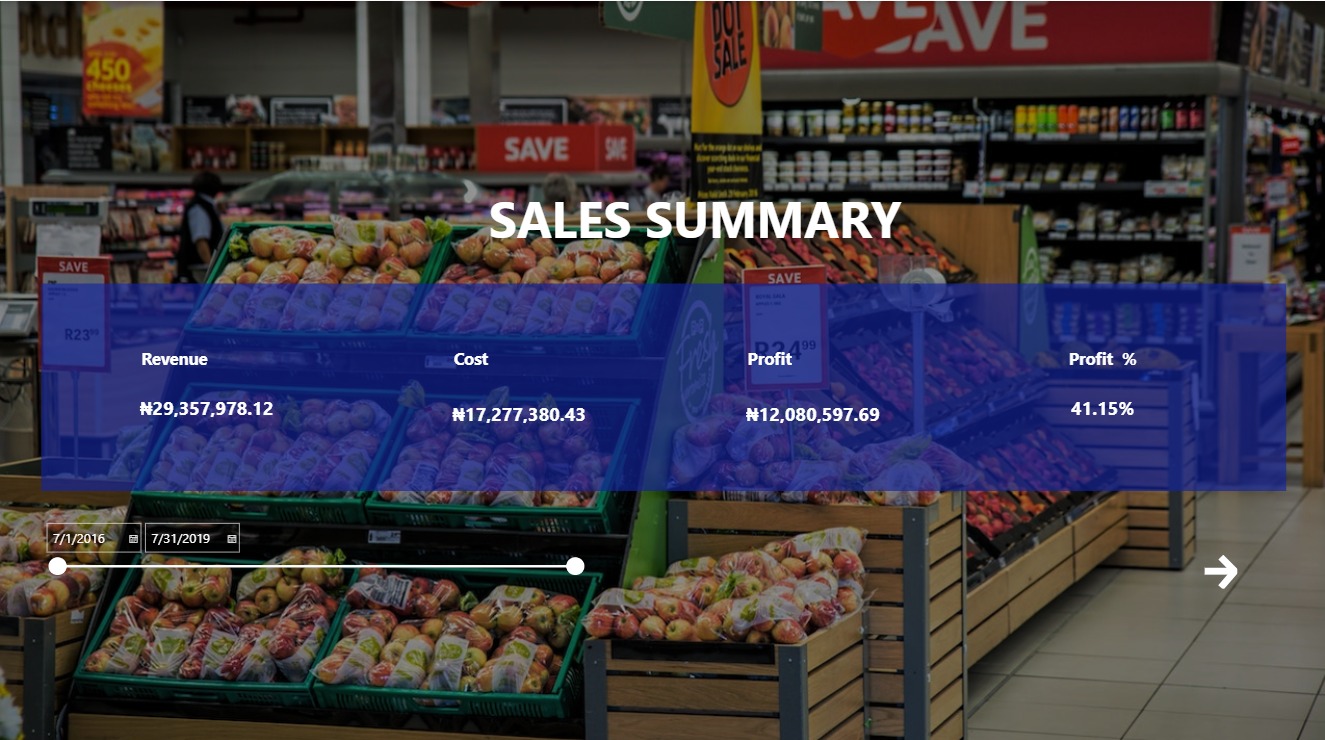
I created an interactive Sales Dashboard for ABC Stores to analyze business performance across different years, months, branches, products, product categories, and customer demographics.
Key Features: Tracked revenue, expenses, profit, profit margin, orders, returns, return rate, products, and customers.
-Analyzed monthly and yearly profit trends and growth.
-Identified the Top 5 products, branches, and product categories by profit.
-Analyzed product return reasons to identify major areas affecting customer satisfaction.
-Compared profit by customer gender.
-Added interactive filters for year, month, and branch to make the dashboard easier to explore.
Tools & Skills Used:
Microsoft Excel
Data Cleaning & Transformation
Pivot Tables & Pivot Charts
Data Analysis
Dashboard Design
Slicers & Interactive Filtering
KPI Analysis
Project Goal: The goal was to transform raw sales data into a clear and interactive dashboard that helps stakeholders quickly understand sales performance, profitability, customer behavior, and areas requiring
Comment (0)
Other projects by Fatima

Talentdigit Resources Limited is a digital training and consulting firm that equips individuals and organizations with digital skills training.


Leave your thought here