
Electronics Retailer Analysis
Project related images. Click to view
Project Overview
This project involved analysing an electronics retailer's sales data using Microsoft Power BI. The aim was to understand the company's overall performance, identify trends, and present useful insights through interactive dashboards.I worked with multiple datasets, including Sales, Customers, Products, Stores, Exchange Rates, and Calendar. I used Power Query for data cleaning and transformation, created relationships between tables, and developed DAX measures to calculate key performance indicators.
????????????????????
1. Summary Dashboard
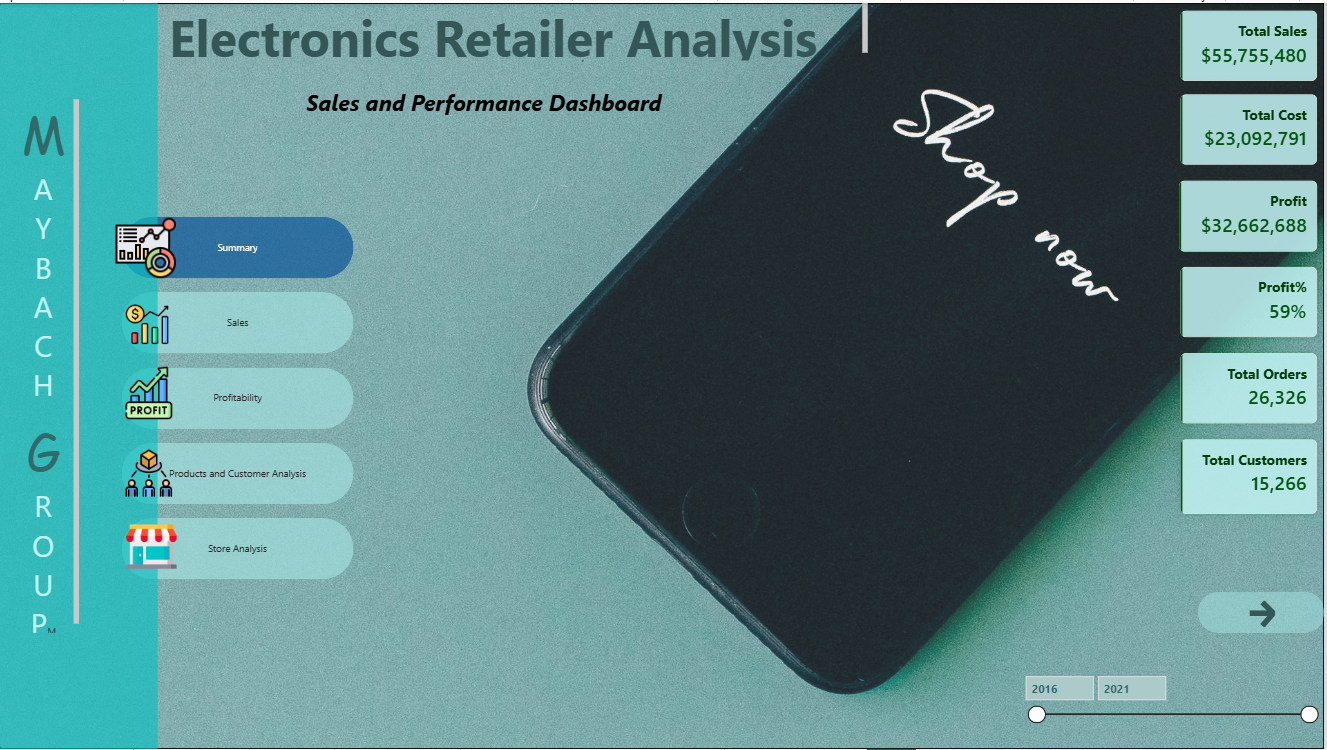
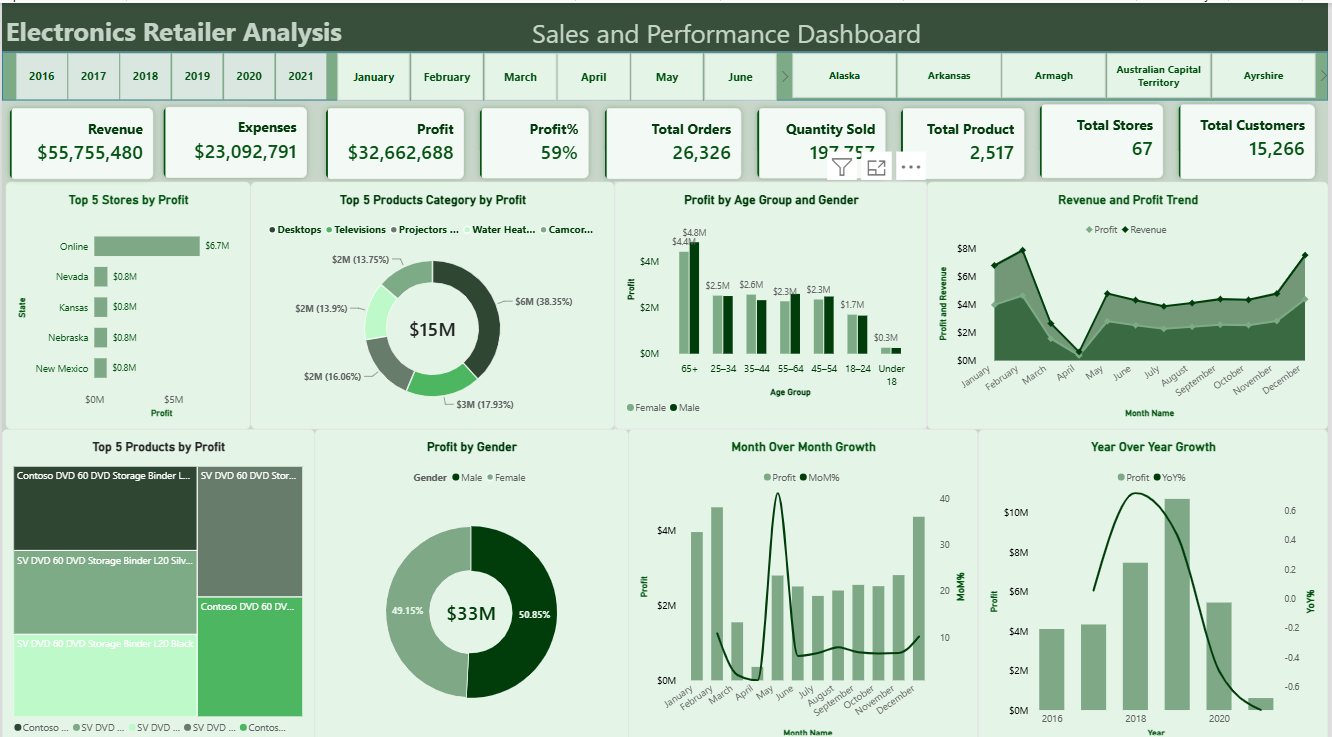
The Summary page provides an overview of the business's performance through key metrics, including total sales, cost, profit, profit margin, total orders, total customers, products, and stores. It also serves as the main navigation page, allowing users to move easily between the five dashboard pages.
????????????????????
2. Sales Analysis
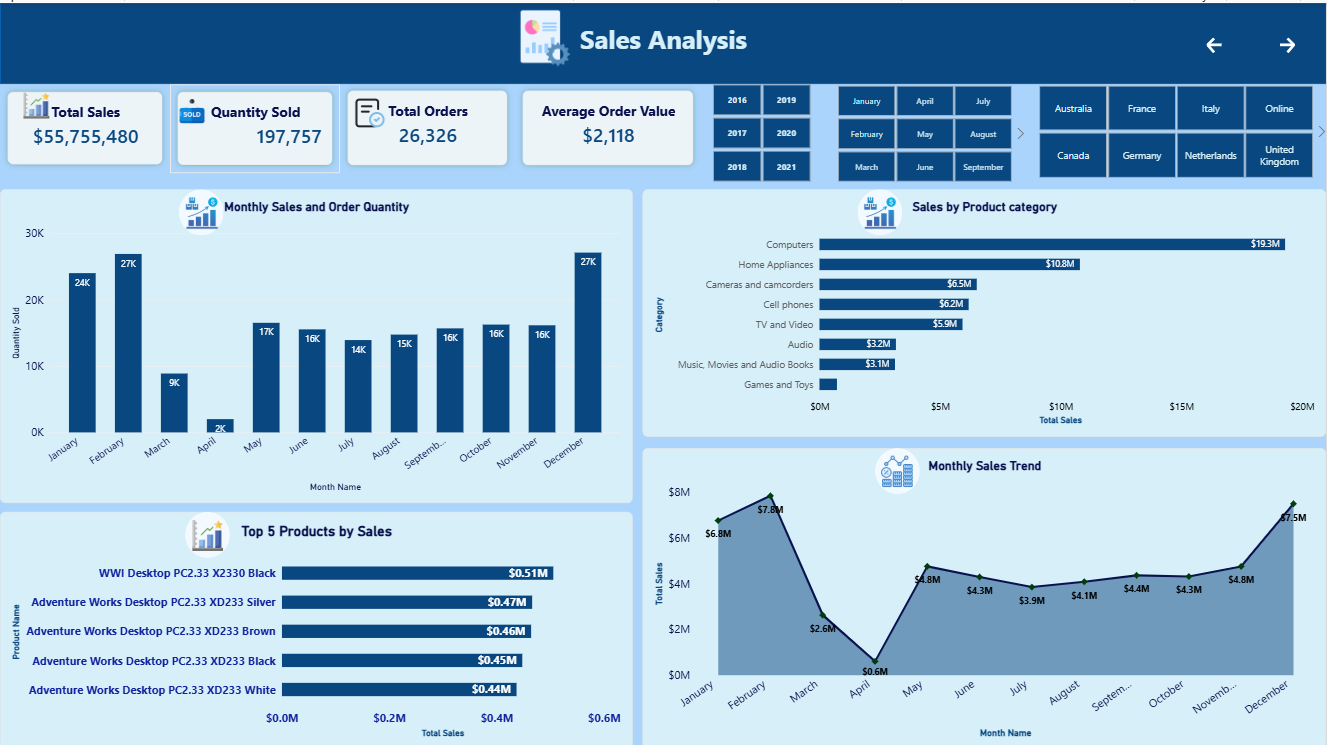
This page focuses on sales performance over time. It includes monthly sales trends, order quantities, sales by product category, and the top five products by sales. The analysis helps identify periods of strong and weak performance, as well as the product categories and individual products contributing most to total sales.
????????????????????
3. Profitability Analysis
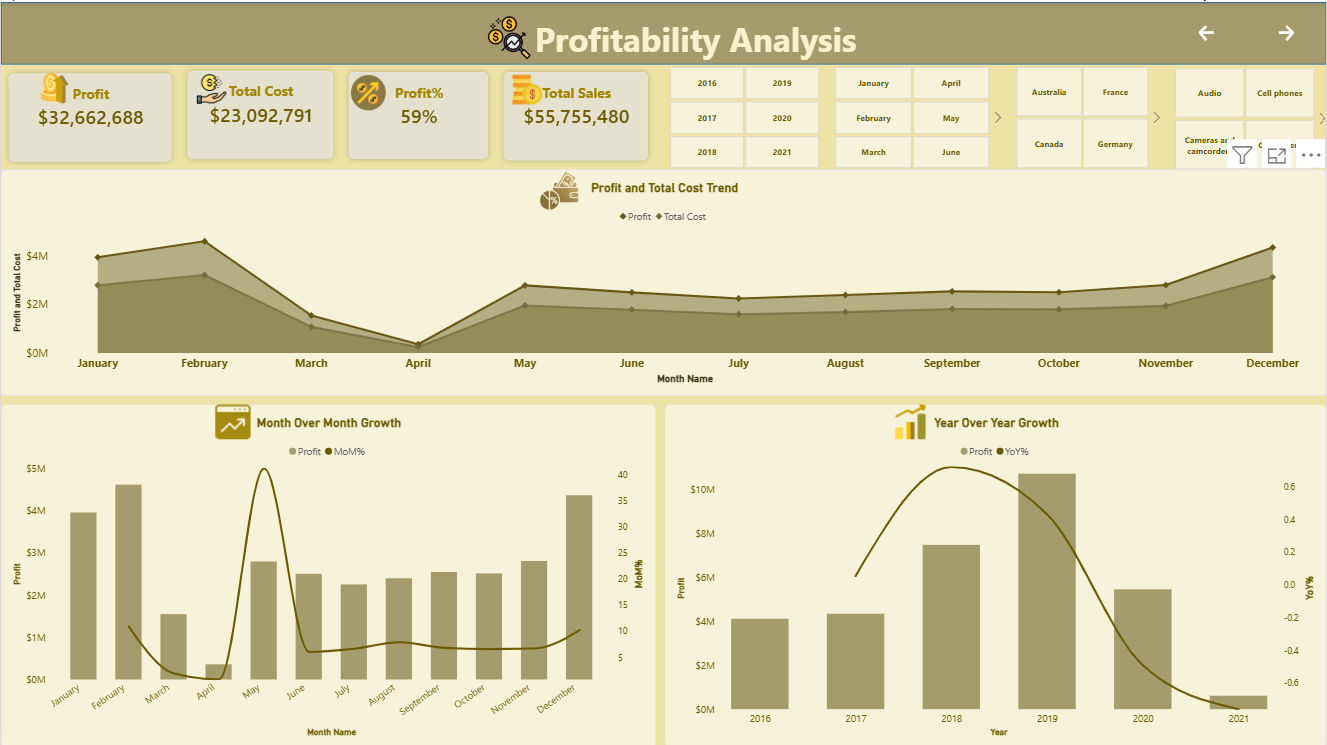
This page examines the relationship between sales, cost, and profit. It includes key profitability metrics, monthly profit and cost trends, and month-on-month and year-on-year performance changes. These visuals help track profitability over time and highlight periods that may require further investigation.
????????????????????
4. Products and Customers Analysis
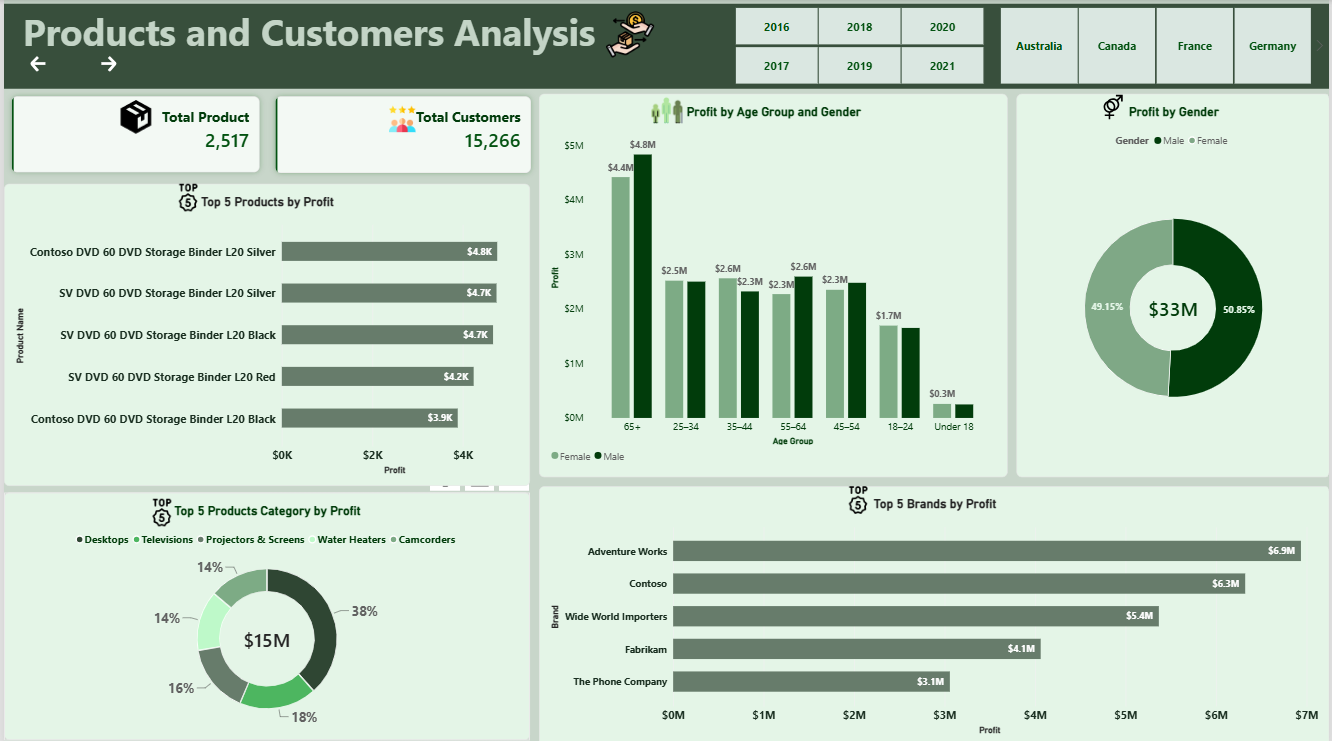
This page explores product and customer performance. It highlights the most profitable products and brands, compares performance across product categories, and examines customer demographics by age group and gender. These insights provide a better understanding of which products perform well and how different customer groups contribute to the business.
????????????????????
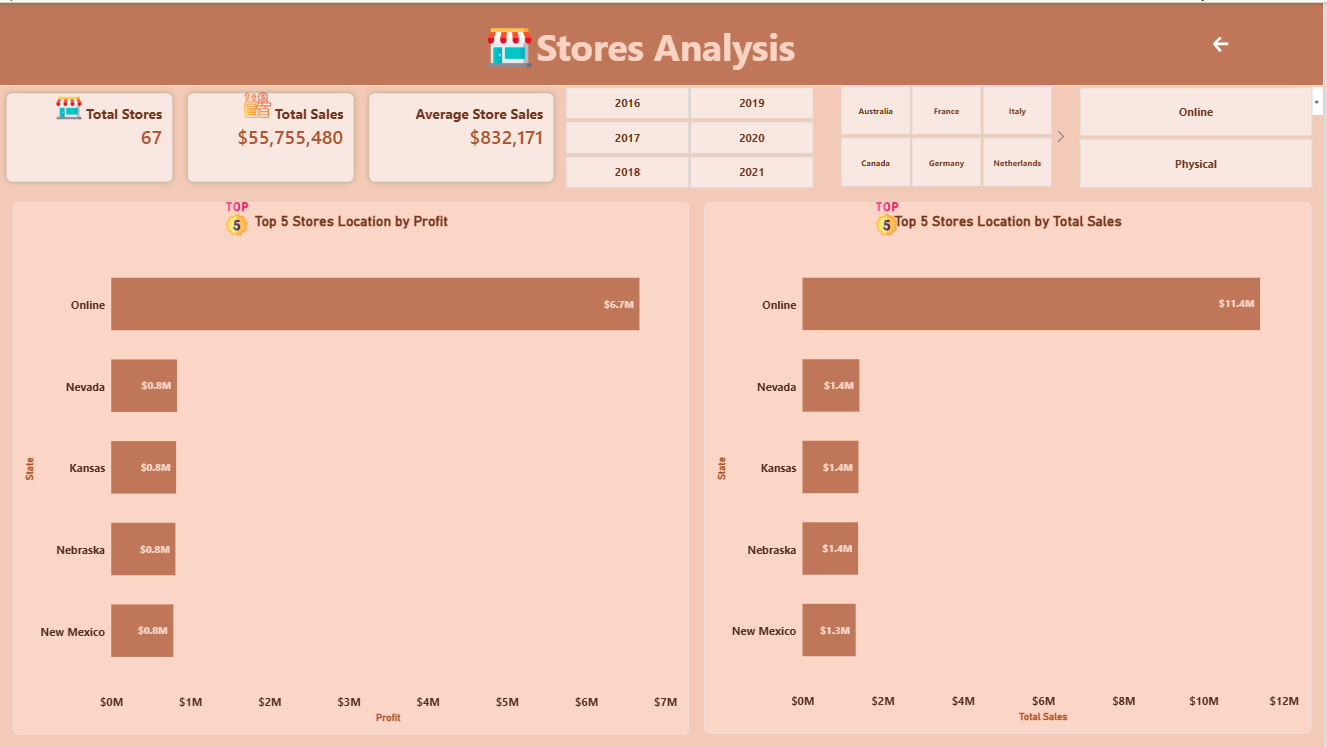
5. Stores Analysis
This page focuses on sales and profit across store locations. It highlights the top-performing locations by sales and profit and allows users to compare online sales with physical store performance. I included a slicer to separate online and physical stores because the online channel's performance could overshadow the results for individual physical locations. This makes it easier to analyse each separately.
????????????????????
Key Findings
The analysis showed that the business generated approximately $55.76 million in sales and $32.66 million in profit, with a profit margin of about 59%. The dashboards also revealed differences in monthly performance, product and brand profitability, customer demographics, and store performance.These findings provide a useful overview of the business and highlight areas where performance can be monitored more closely.
????????????????????
Project Reflection
Working on this project gave me practical experience in turning raw data into meaningful insights and presenting those insights in a clear, visual format. It also helped me improve my understanding of Power BI, especially in data modelling, DAX calculations, and designing dashboards that users can interact with to explore business performance.
Comment (0)
Other projects by Fatima

Talentdigit Resources Limited is a digital training and consulting firm that equips individuals and organizations with digital skills training.


Leave your thought here