Dunsin Retail Hub

Project related images. Click to view
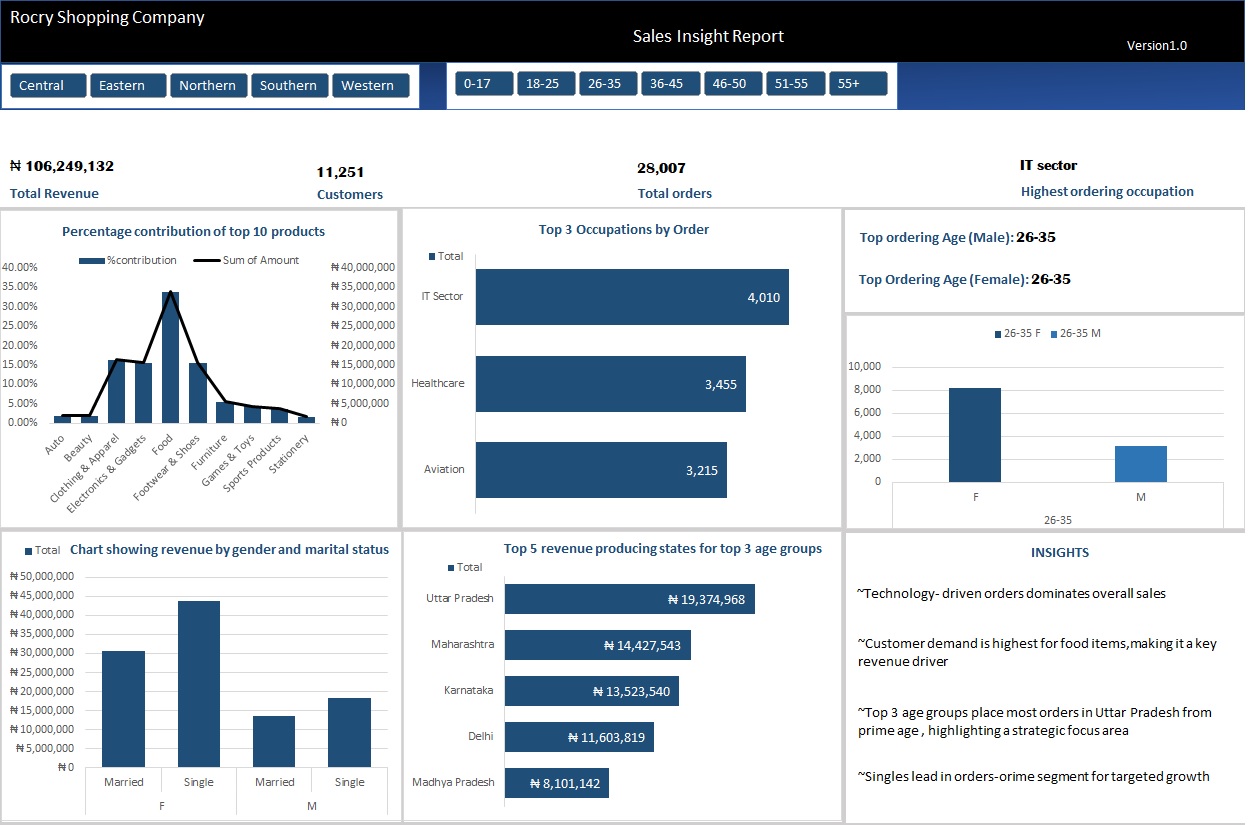
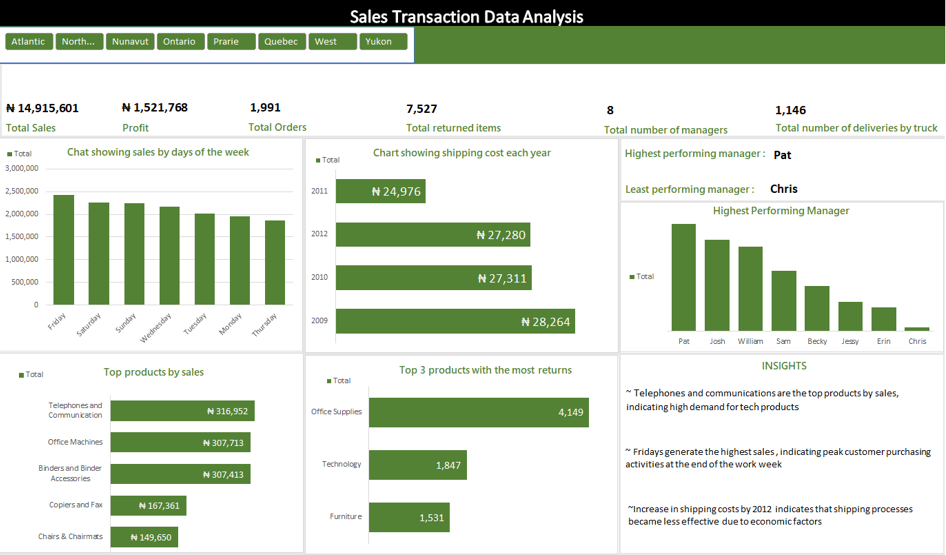
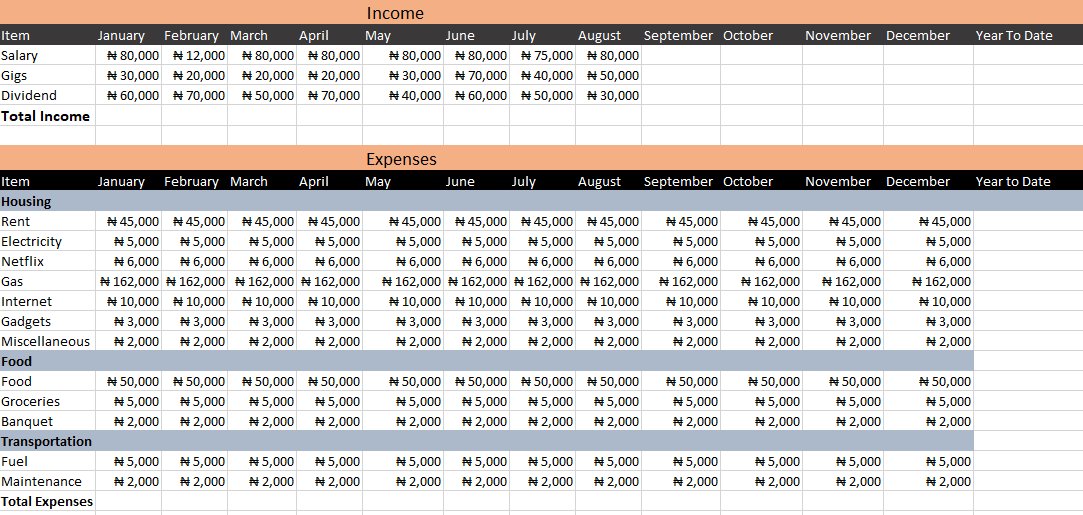
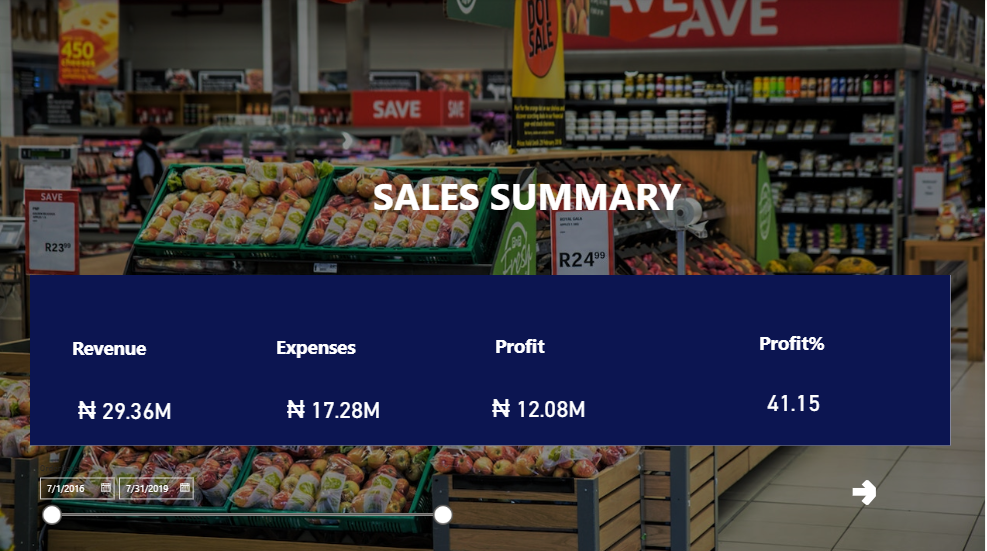
This dashboard provides a comprehensive view of sales performance for Dunsin Retail Hub across multiple years and branch locations. It summarizes critical business metrics such as revenue, expenses, profit margin, orders, returns, and customer count, offering a clear snapshot of the company’s financial health and operational efficiency.
Key Features:
- KPI Summary: Displays core metrics like revenue, expenses, profit, and orders for quick performance assessment.
- Profit Trend Analysis: Tracks month-over-month and year-over-year profit growth to identify patterns and long-term trends.
- Top Products & Categories: Highlights the most profitable products and categories to guide inventory, marketing, and pricing decisions.
- Branch Performance: Compares profitability across locations to optimize resource allocation and regional strategies.
- Returns Analysis: Shows return rates and reasons, providing insights for improving customer satisfaction and reducing operational losses.
- Customer Demographics: Breaks down profit contribution by customer segments, such as gender, to understand market reach.
- Interactive Filters: Allows filtering by year and branch for detailed, data-driven analysis.
Comment (0)
Other projects by Oluwadunsin
Talentdigit Resources Limited is a digital training and consulting firm that equips individuals and organizations with digital skills training.
Address: 4 Amurie omanze street (off star time junction) Garki 2, Abuja
For Inquiries Call: +234 (0) 7062274671


Leave your thought here