Sales Analysis
Project related images. Click to view
Sales Analysis with Power BI
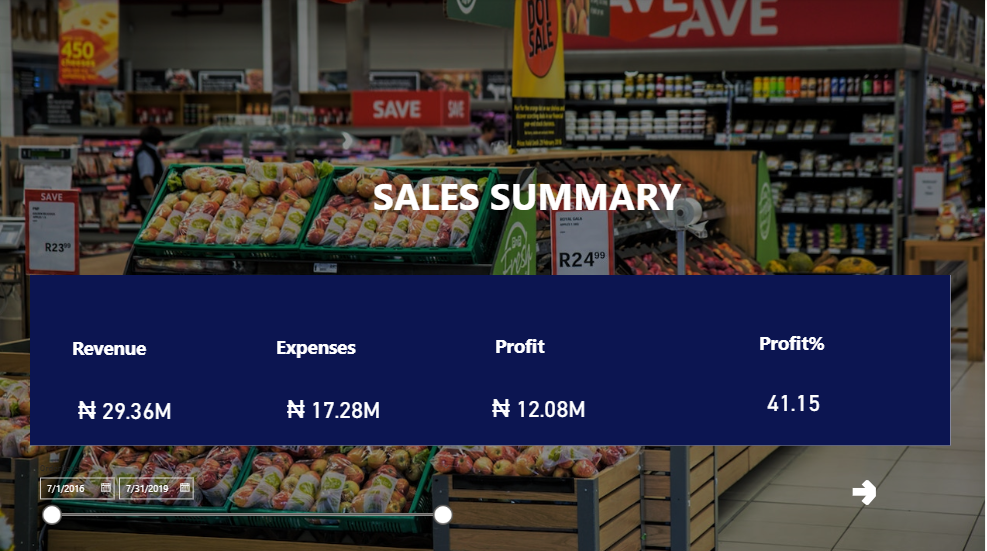
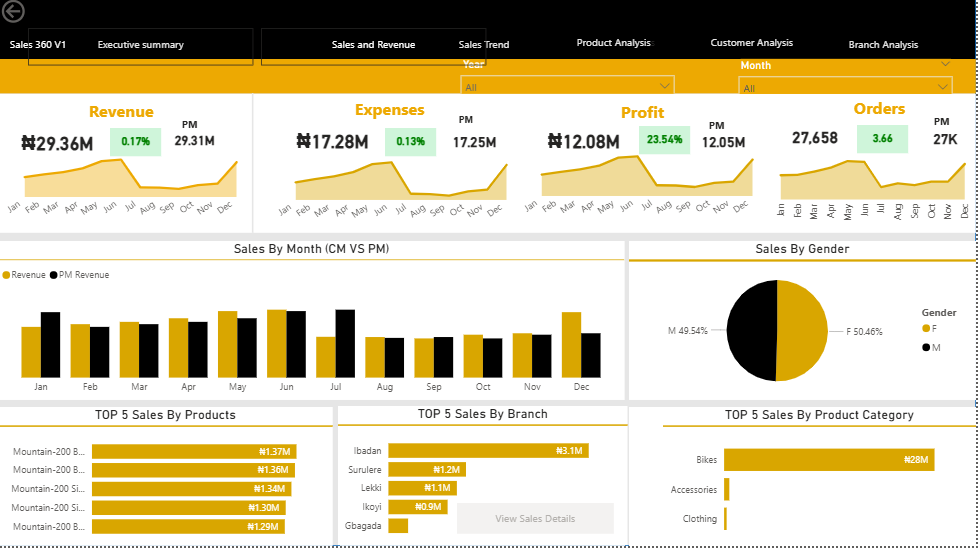
This sales dashboard provides a clear summary of business performance by displaying revenue, expenses, profit, and total orders over time. It compares current month and previous month sales to help identify trends, growth patterns, and performance changes. The dashboard also highlights top-performing products, branches, and product categories, as well as customer distribution by gender.
Features
- Revenue, expenses, profit, and orders tracking
- Current vs previous month sales comparison
- Monthly sales trend analysis
- Top 5 products, branches, and categories
- Sales distribution by gender
- Simple and visually clear charts for easy interpretation
Uses
- Monitoring overall business performance
- Identifying best-selling products and branches
- Detecting sales trends and seasonal patterns
- Supporting management and strategic decisions
- Improving sales and marketing planning
Comment (0)
Other projects by Oluwadunsin

Talentdigit Resources Limited is a digital training and consulting firm that equips individuals and organizations with digital skills training.
Address: 4 Amurie omanze street (off star time junction) Garki 2, Abuja
For Inquiries Call: +234 (0) 7062274671


Leave your thought here