
E-Beauty Castle Sales Overview Dashboard
Project related images. Click to view
Project Overview
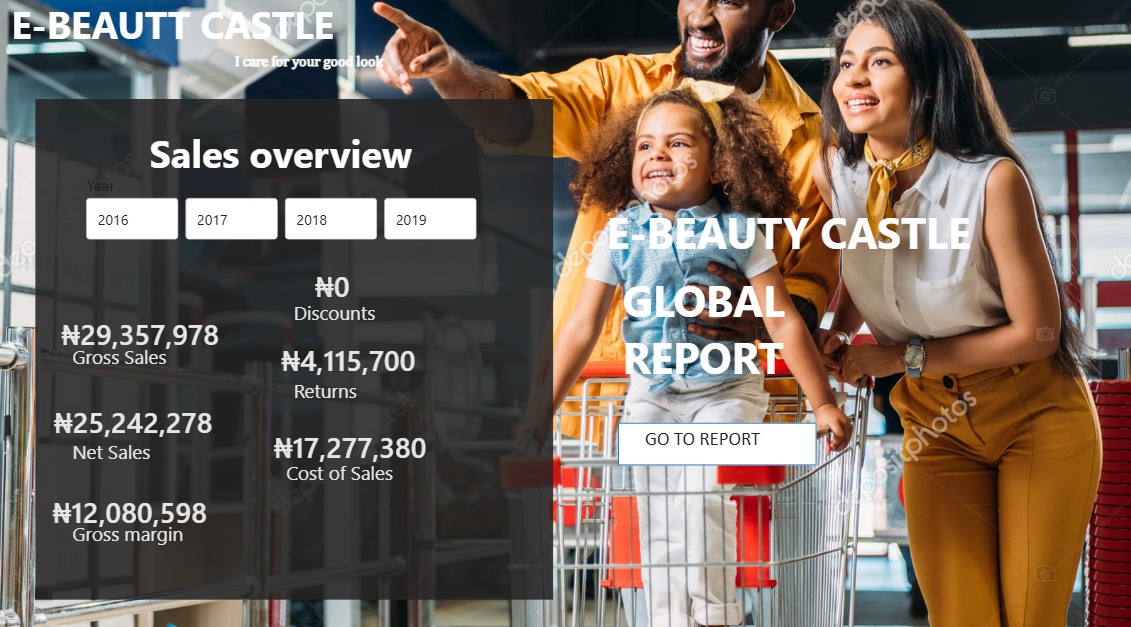
?Developed an interactive executive sales dashboard for E-Beauty Castle using Power BI to track, analyze, and visualize multi-year retail performance metrics from 2016 to 2019. This solution empowers stakeholders with actionable insights into overall business health and profitability.
?Key Performance Indicators (KPIs) & Metrics Tracked
?Gross Sales: Monitored total revenue generation reaching #29,357,978.
?Net Sales: Tracked total revenue after deductions, totaling #25,242,278.
?Gross Margin: Evaluated overall profitability standing at #12,080,598.
?Cost & Operational Metrics: Analyzed #17,277,380 in Cost of Sales and #4,115,700 in product returns.
?Promotional Impact: Tracked promotional discounts (#0) across specific fiscal periods.
?Key Features & Functionality
?Multi-Year Filtering: Integrated intuitive year-slicers (2016, 2017, 2018, 2019) allowing users to dynamically filter and compare historical performance.
?Global Report Navigation: Designed a dedicated drill-through button (GO TO REPORT) for seamless navigation into granular regional and product category reports.
?Executive Layout: Built a modern, dark-themed dashboard optimized for executive presentations and quick decision-making.
?Tools & Skills Used
?Microsoft Power BI (Data Modeling, DAX, Dashboard Design)
?Data Visualization & Business Analytics
Comment (0)
Other projects by Esther

Talentdigit Resources Limited is a digital training and consulting firm that equips individuals and organizations with digital skills training.


Leave your thought here