Sales summary
Project related images. Click to view
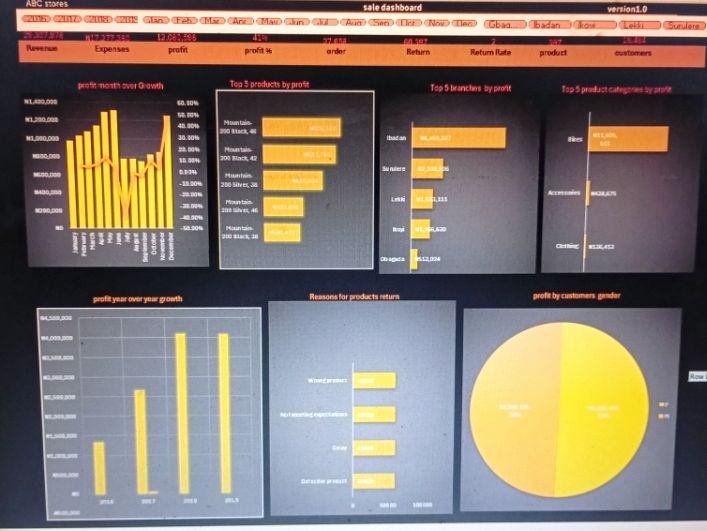
Project Overview: Power BI Lab 1 – RetailBiz Stores Sales Summary
?RetailBiz Stores Limited is a B2C e-commerce platform that sells a variety of products and delivers to clients across different locations in Nigeria (such as Ibadan, Ikeja, and Surulere), where individual branch managers operate against set targets. This project involves developing professional, multi-page Power BI dashboards to analyze critical business dimensions, including branch insights, product performance, customer metrics, sales insights, and sales trends.
?Key Features & Implementation Details
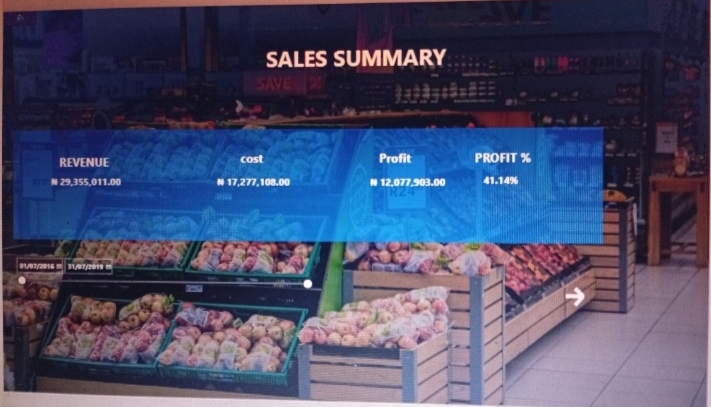
?Sales Summary Dashboard Design: Created a visually engaging executive summary page featuring a custom e-commerce canvas background image (bg.png) with zero transparency and full fill settings.
?Calculated DAX Measures: Established a dedicated Calculations table to host core financial formulas:
?Revenue: SUM(Sales[SalesAmount]) formatted in Nigerian Naira (?).
?Cost: SUM(Sales[ProductCost]) formatted in Nigerian Naira (?).
?Profit: Calculated as [Revenue] - [Expenses] and formatted in Nigerian Naira (?).
?Profit %: Calculated using DIVIDE([Profit], [Revenue], 0) and formatted as a percentage.
?Advanced Visual Layout: Designed a semi-transparent dark blue rectangular container to neatly organize key performance indicators (KPIs). Configured card visuals with transparent backgrounds, disabled borders, and bold white Segoe typography for a clean aesthetic.
?Interactive Date Filtering: Implemented a dynamic date range slicer connected to the OrderDate field to allow stakeholders to filter performance metrics seamlessly.
?Seamless Navigation: Added a custom right-pointing arrow button styled with custom line weight, size, and white coloring to facilitate easy navigation for stakeholders moving to other analytical reports.
Comment (0)
Other projects by Esther

Talentdigit Resources Limited is a digital training and consulting firm that equips individuals and organizations with digital skills training.


Leave your thought here