
Hotel booking dashboard
Project related images. Click to view
About the project
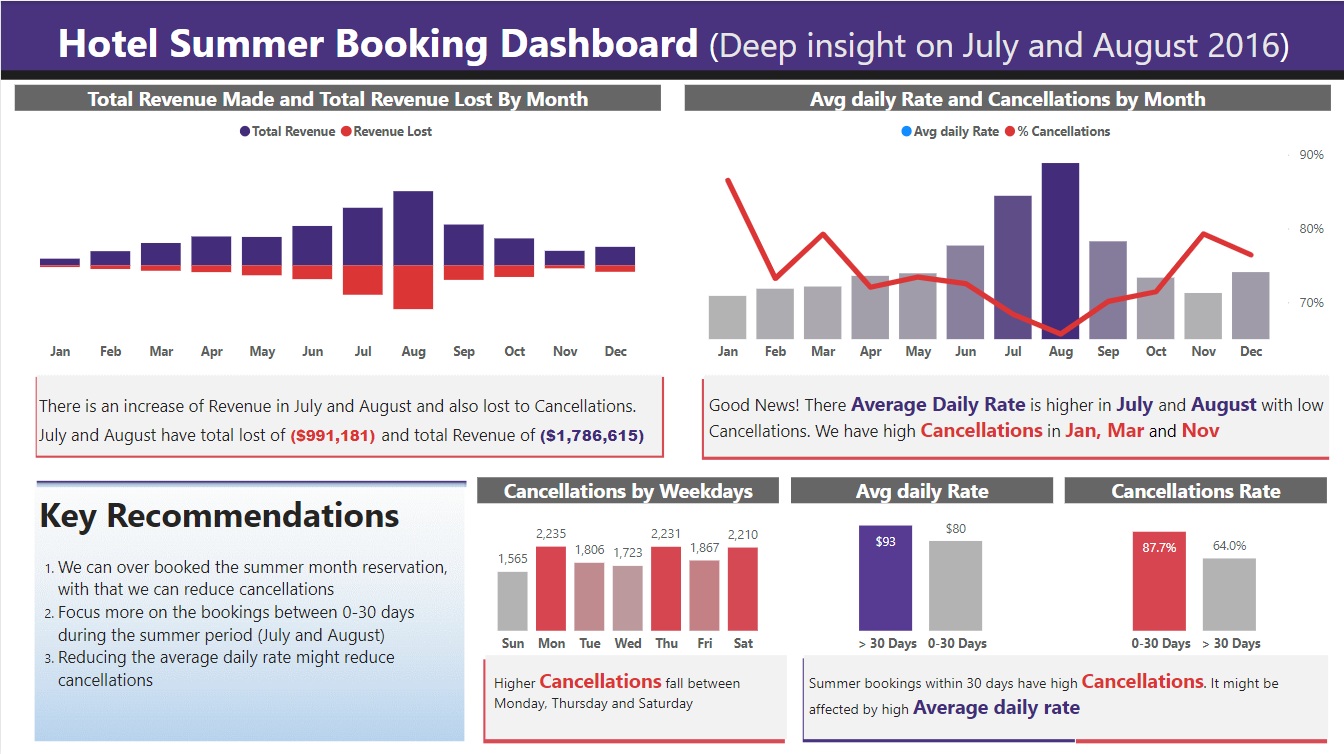
The hotel booking summer dashboard analyzes hotel data to derive deep insights in July and August 2016. In this analysis I was able to clean the data, modelled it and created charts to show average daily rate, cancellation weekday and total revenue made and lost in 2016 in the months of July and August.
Tools used
- Microsoft Power BI Desktop
- Microsoft Excel and
- Microsoft PowerPoint to design the user interface.
Findings
- There is an increase in Revenue and also lost to cancellations.
- July and August have total lost of $9991, 181 and total revenue of $1,786, 615
- Higher cancellations fall between Monday, Thursday and Saturday.
Comment (1)
Leave your thought here
Other projects by Daniel Samuel
Talentdigit Resources Limited is a digital training and consulting firm that equips individuals and organizations with digital skills training.
Address: 4 Amurie omanze street (off star time junction) Garki 2, Abuja
For Inquiries Call: +234 (0) 7062274671


Paul Edem
Wow! This looks beautiful. Well done Daniel.