
Retail Analytics
Project related images. Click to view
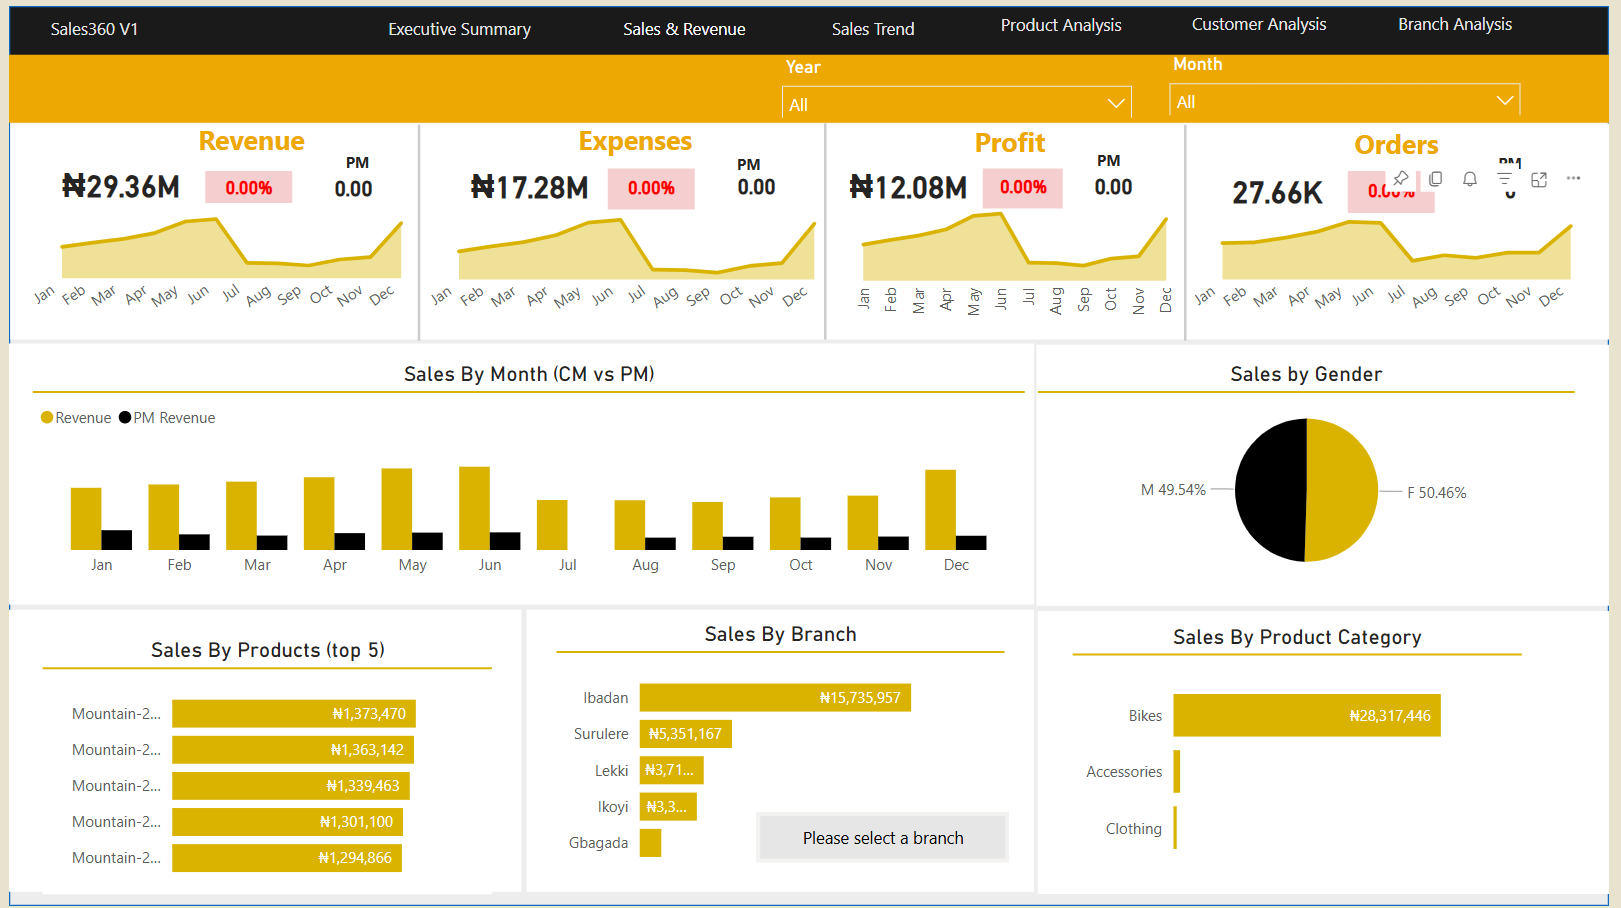
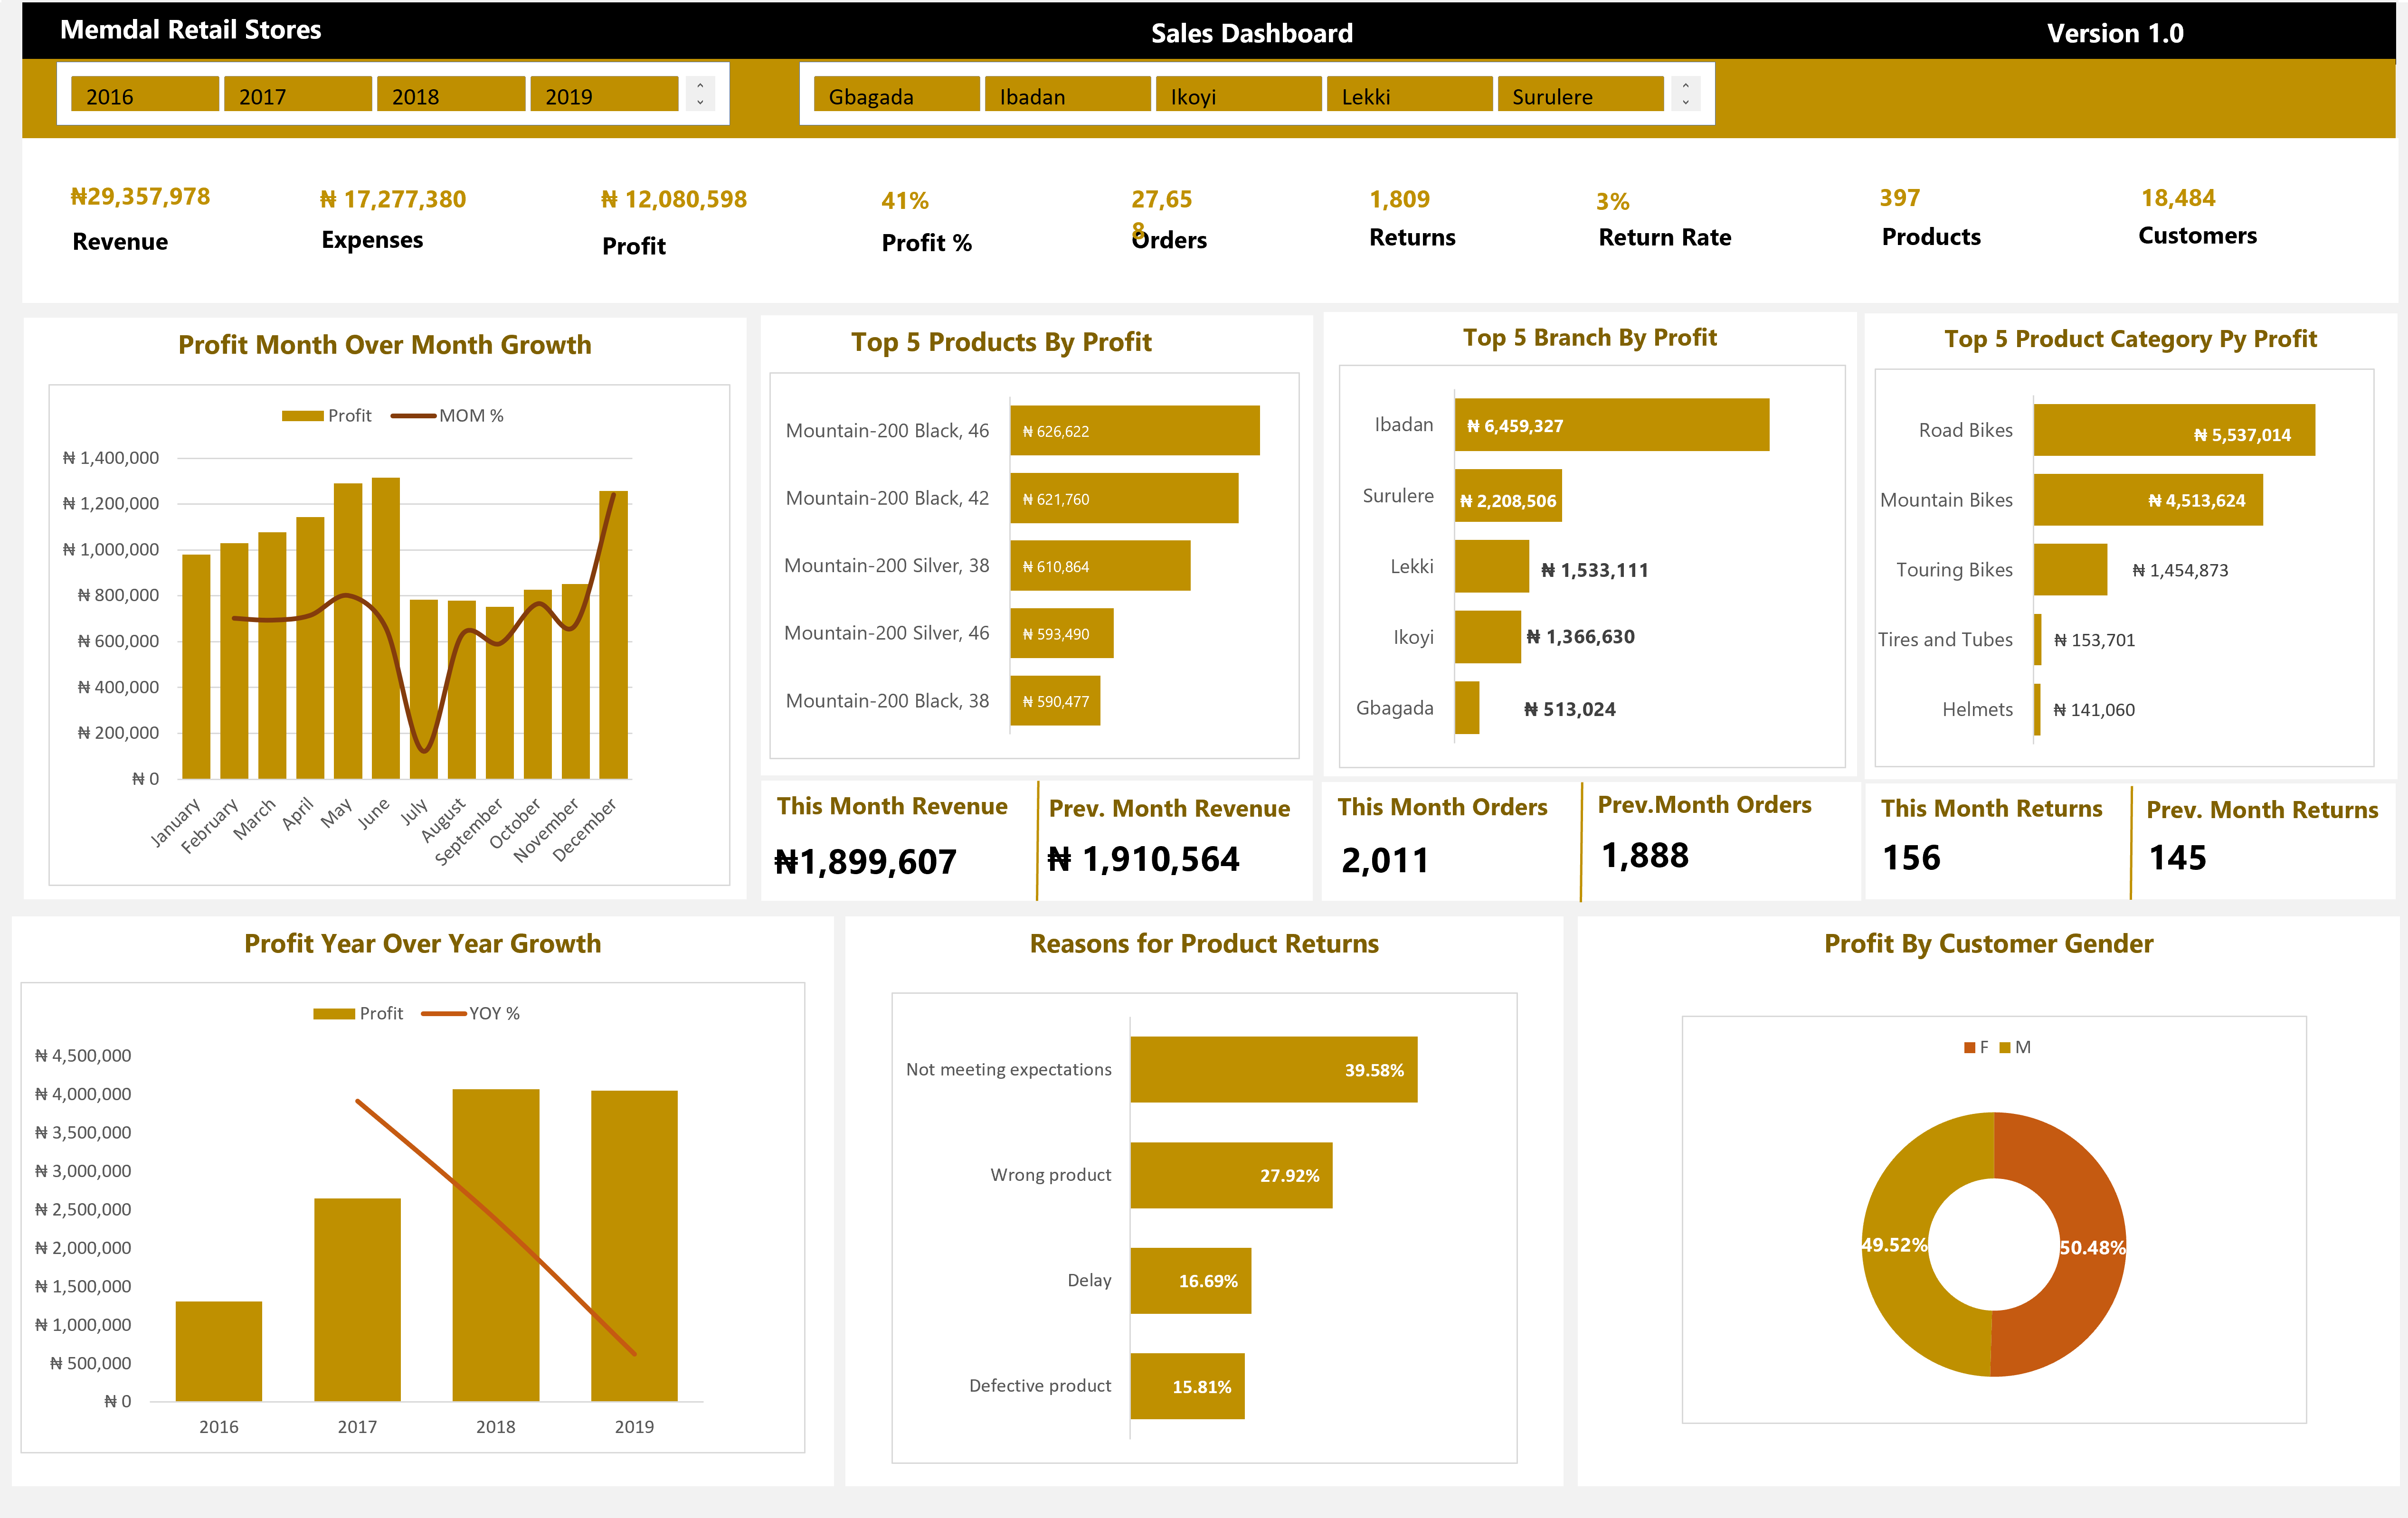
Sales Dashboard – Power BI
This interactive Power BI Sales Dashboard provides key insights into revenue performance across multiple dimensions, including branch locations, product categories, and sales trends. It features dynamic visualizations, KPI metrics, and drill-down capabilities to help stakeholders make data-driven decisions. The dashboard enhances business intelligence by uncovering patterns in sales performance, identifying top-selling products, and highlighting revenue growth opportunities.
Comment (0)
Other projects by Daniel Samuel
Talentdigit Resources Limited is a digital training and consulting firm that equips individuals and organizations with digital skills training.
Address: 4 Amurie omanze street (off star time junction) Garki 2, Abuja
For Inquiries Call: +234 (0) 7062274671


Leave your thought here