
Sales Performance and Profitability Dashboard
Project related images. Click to view
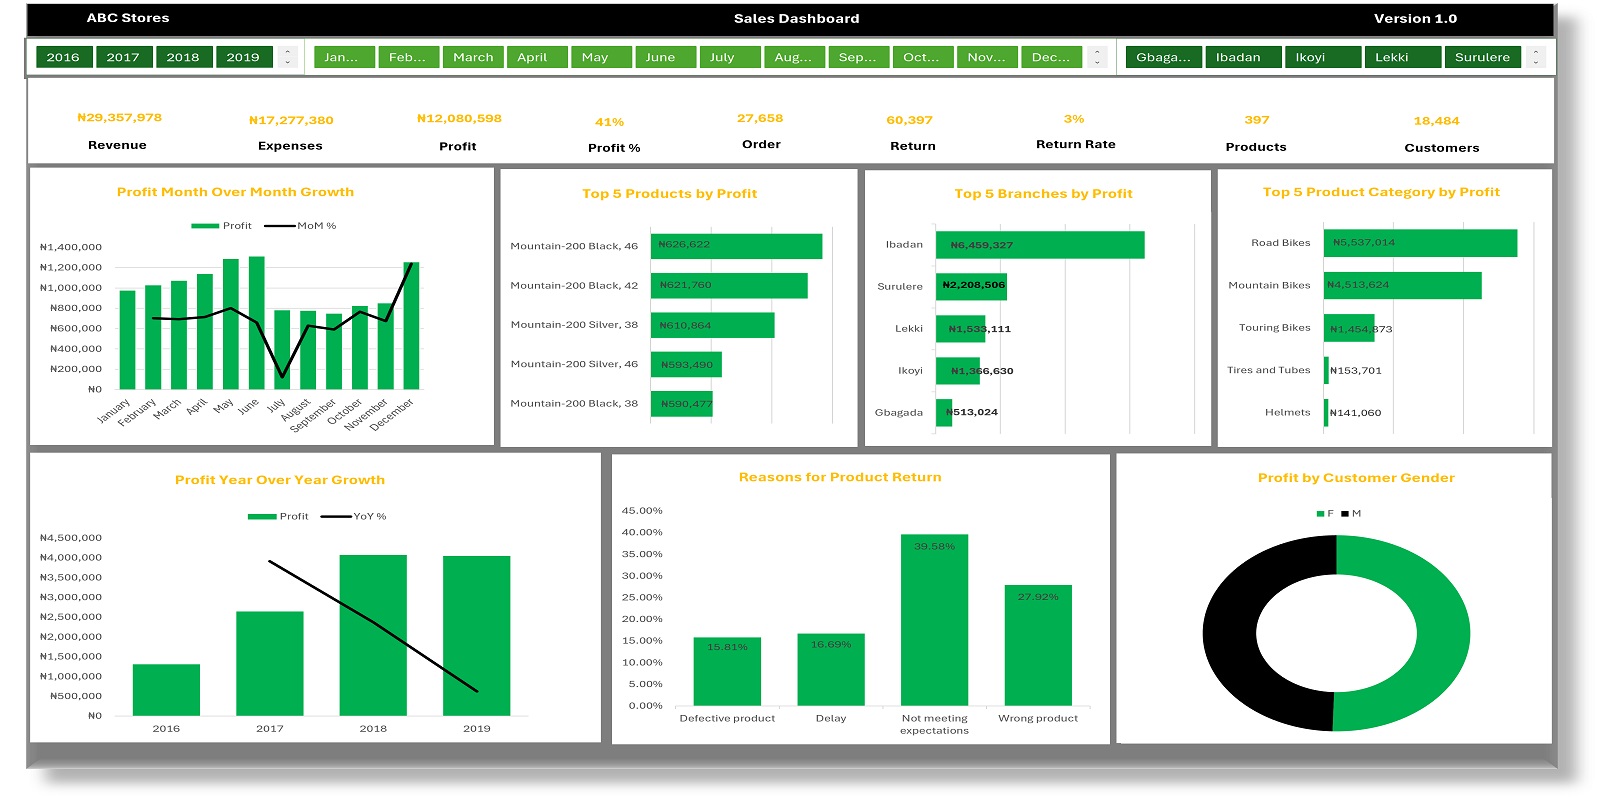
Developed an interactive business intelligence project designed to analyze revenue, expenses, profitability, sales growth, product performance, branch performance, product returns, and customer demographics. The dashboard transforms raw sales data into actionable insights using interactive filters, KPIs, charts, and visualizations to support data-driven business decisions.
Objectives
- Analyze revenue, expenses, and overall profitability.
- Track monthly and yearly profit growth.
- Identify top-performing products, branches, and product categories.
- Analyze product returns and the reasons behind them.
- Examine profit distribution by customer gender.
- Provide interactive filters for year, month, and branch to support dynamic analysis.
Comment (0)
Other projects by Blessing

Talentdigit Resources Limited is a digital training and consulting firm that equips individuals and organizations with digital skills training.


Leave your thought here