
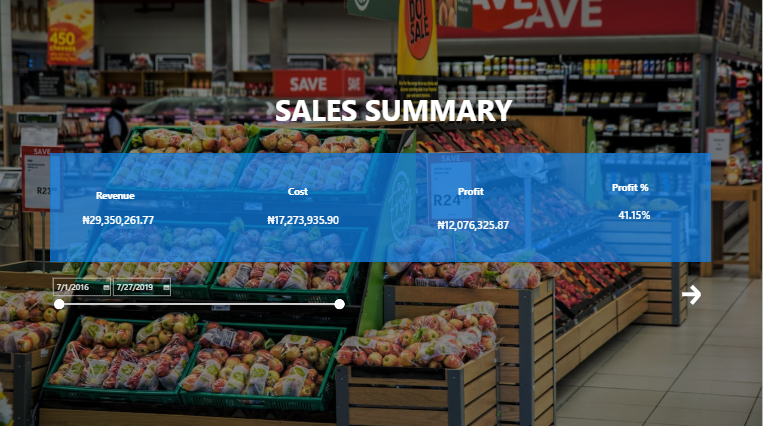
Sales Summary Dashboard
Project related images. Click to view
An interactive Power BI sales dashboard developed to transform sales data into meaningful business insights. The dashboard tracks revenue, costs, profit and profit margin while providing users with an intuitive date filter for dynamic performance analysis. This project demonstrates my ability to clean, analyze, visualize, and communicate data effectively for business decision-making.
Comment (0)
Other projects by Blessing


Talentdigit Resources Limited is a digital training and consulting firm that equips individuals and organizations with digital skills training.


Leave your thought here