
Data Analysis and Dashboard Design for ABC Stores.
Project related images. Click to view
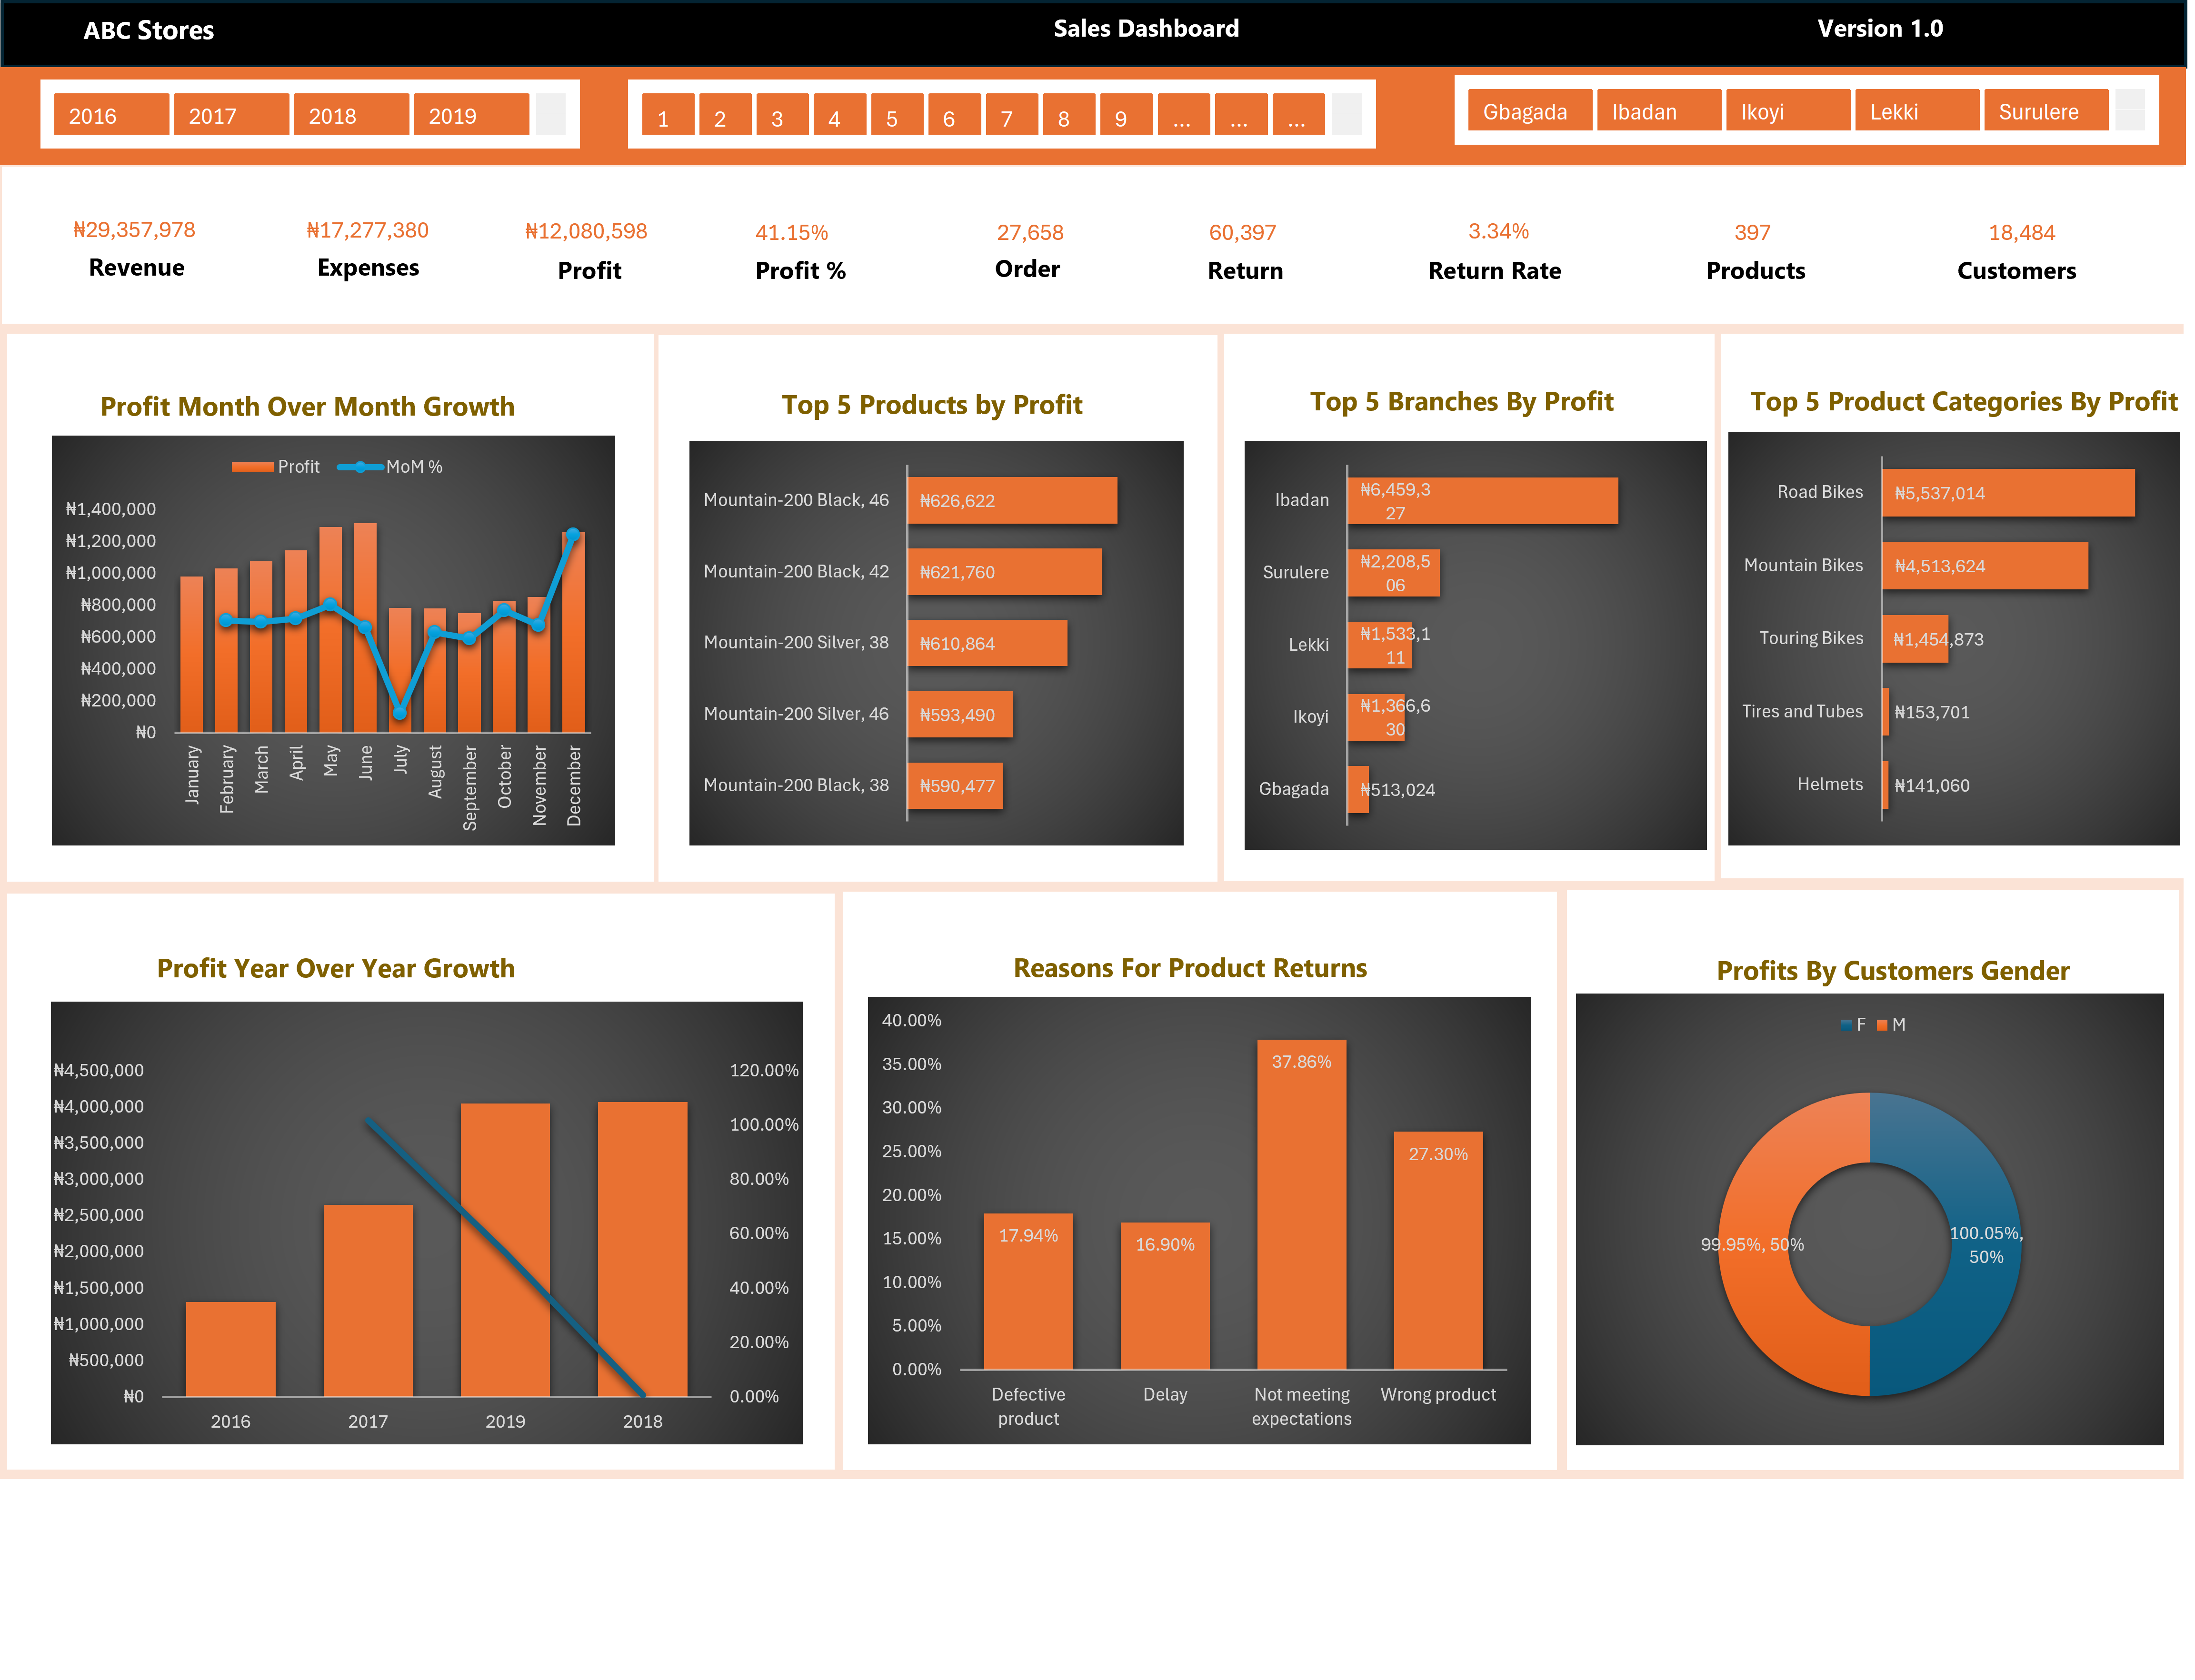
I designed an Interactive Sales Analysis Dashboard for ABC Stores to analyse reports across deviant years, products, Inventories, branches and customers. Key Features for this analysis are:- Profits, Profit percentage, Revenue, Return rates, Orders, Returns and Customers.
ANALYSIS
1. Analyzed Top 5 products by profits which generates the highest profits from sales. 2. Analyzed Profit Month over Month growth which analyses monthly growth rates of sales. 3. Analyzed Top 5 Branches By Profits, which shows the top branches ranked by profitability. 4. Analyzed Top 5 products Categories By Profits, which analyses products categories based on total profits generated. 5. Analyzed Profit Year Over Year Growth to see if sales are making more profits over the years. 6. Identified Reasons For Product Returns, to fix product quality and improve customer satisfaction. 7. Analyzed Profits By Customer Gender, to identify potential growth in each segments. Tools and Skill Employed:- Microsoft Excel. Data Cleaning, transformation and modelling. Data Analysis. Power Query Option. Dashboard Design
Comment (0)
Other projects by Utibe Abasi

Talentdigit Resources Limited is a digital training and consulting firm that equips individuals and organizations with digital skills training.


Leave your thought here