
Sales Summary Dashboard
Project related images. Click to view
Sales Performance Dashboard — Power BI
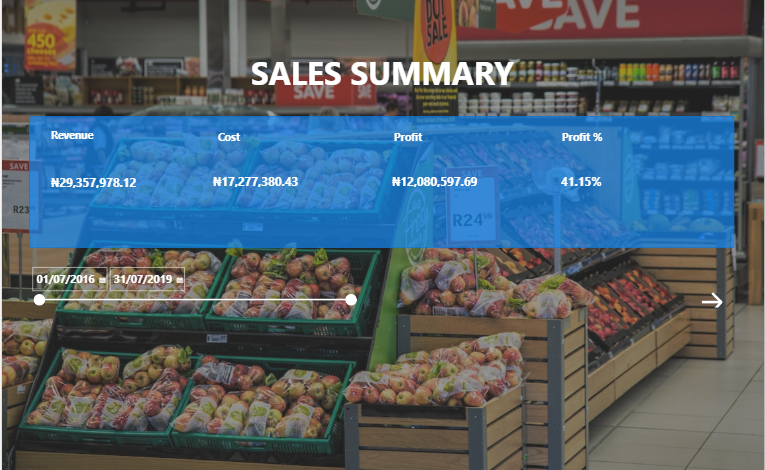
I Designed and developed an interactive Sales Summary Dashboard in Power BI to track key business metrics including Gross Sales ($29.3M), Net Sales, Total Cost, Profit ($12.08M), Profit Margin (41.15%), and Returns.
Key operations performed: Data modeling, DAX measure creation (SUM, DIVIDE, SUMX), handling blank/discount values, calculating Net Sales after returns, currency and percentage formatting, and modern UI design using blue transparent shapes with high-contrast typography for KPI visibility.
Skills: Power BI Desktop, DAX, Data Modeling, KPI Design, Data Cleaning
Comment (0)
Other projects by Utibe Abasi


Talentdigit Resources Limited is a digital training and consulting firm that equips individuals and organizations with digital skills training.


Leave your thought here