
Miramart Sales Performance Dashboard
Project related images. Click to view
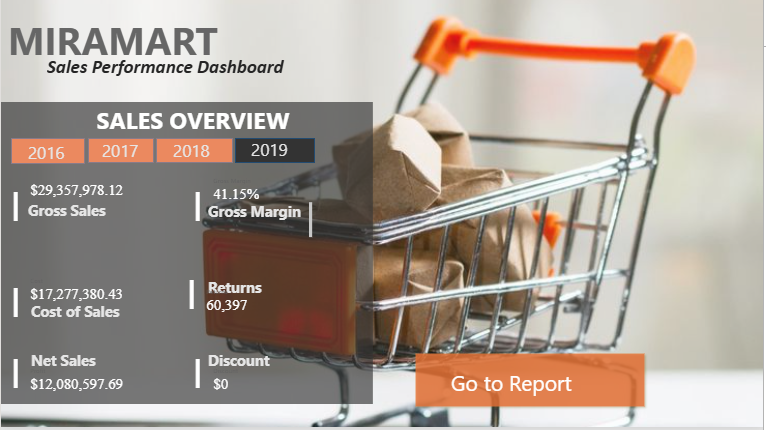
Miramart Executive Sales Dashboard in Power BI.
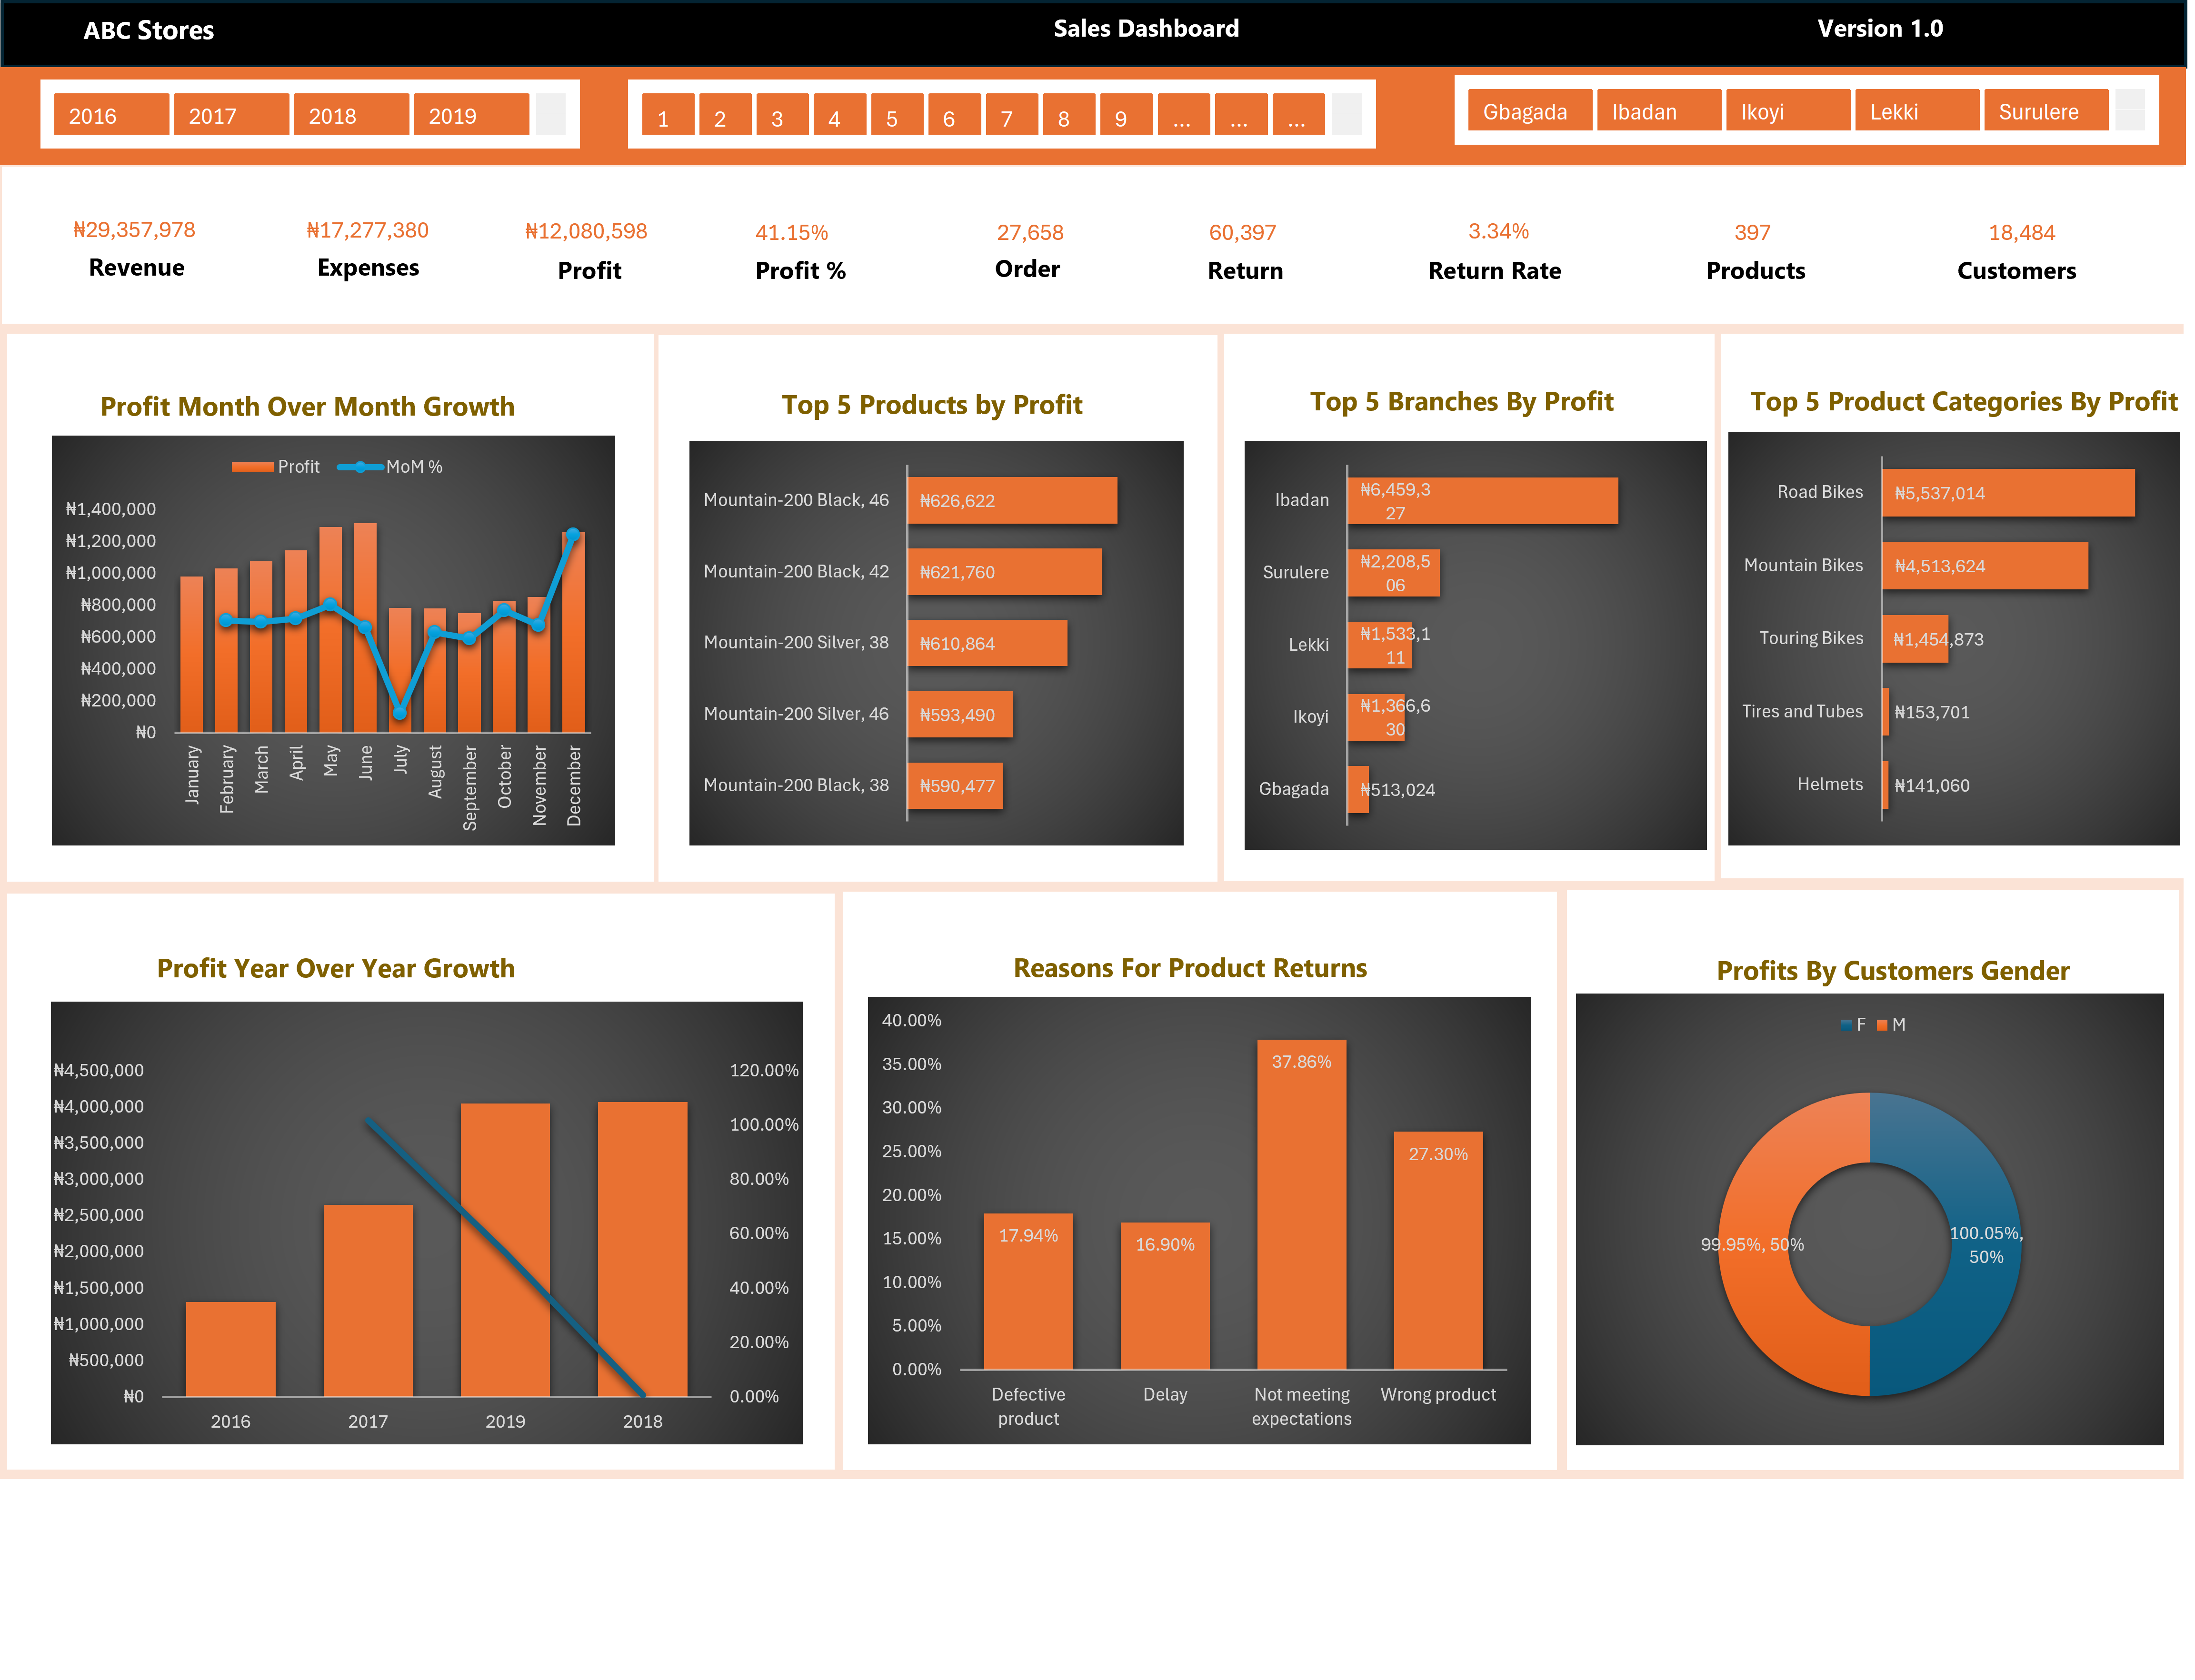
Built a complete end-to-end sales analytics dashboard transforming raw sales data into actionable insights.
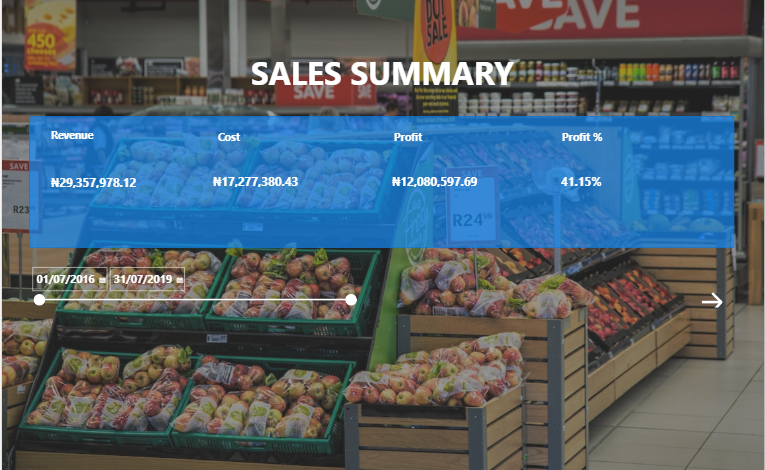
I calculated Gross vs Net Sales, Cost of Goods Sold, Profit, Profit %, and Returns Analysis. Solved DAX issues like zero-value discounts using SUM + 0 logic and proper data type conversion to ensure accurate reporting.
Focused on clean, executive-level visual design with transparent cards, white and orange contrast for readability.
Tools Used: Power BI, DAX, Power Query, Data Visualization Best Practices
Comment (0)
Other projects by Utibe Abasi

Talentdigit Resources Limited is a digital training and consulting firm that equips individuals and organizations with digital skills training.


Leave your thought here