Fresh Cart Ads Campaign Dashboard
Project related images. Click to view
Fresh
Cart Ads Campaign Dashboard
Project
objective: To monitor, evaluate, and
optimize the performance of digital ad campaigns across various platforms and
U.S. states, ensuring maximum return on ad spend (ROAS), improved conversions,
and efficient cost allocation.
Aim:
To track
advertising effectiveness across multiple platforms (YouTube,
Twitter, Facebook, Instagram, Google Ads) and identify top-performing regions and channels to guide
future ad spend and strategy decisions.
Goals:
- Maximize
conversion value and increase ROAS (return on ad spend)
- Identify
high-performing platforms & regions to optimize ad spend
allocation
- Monitor trends and growth over time and Improve
click-through & conversion rates
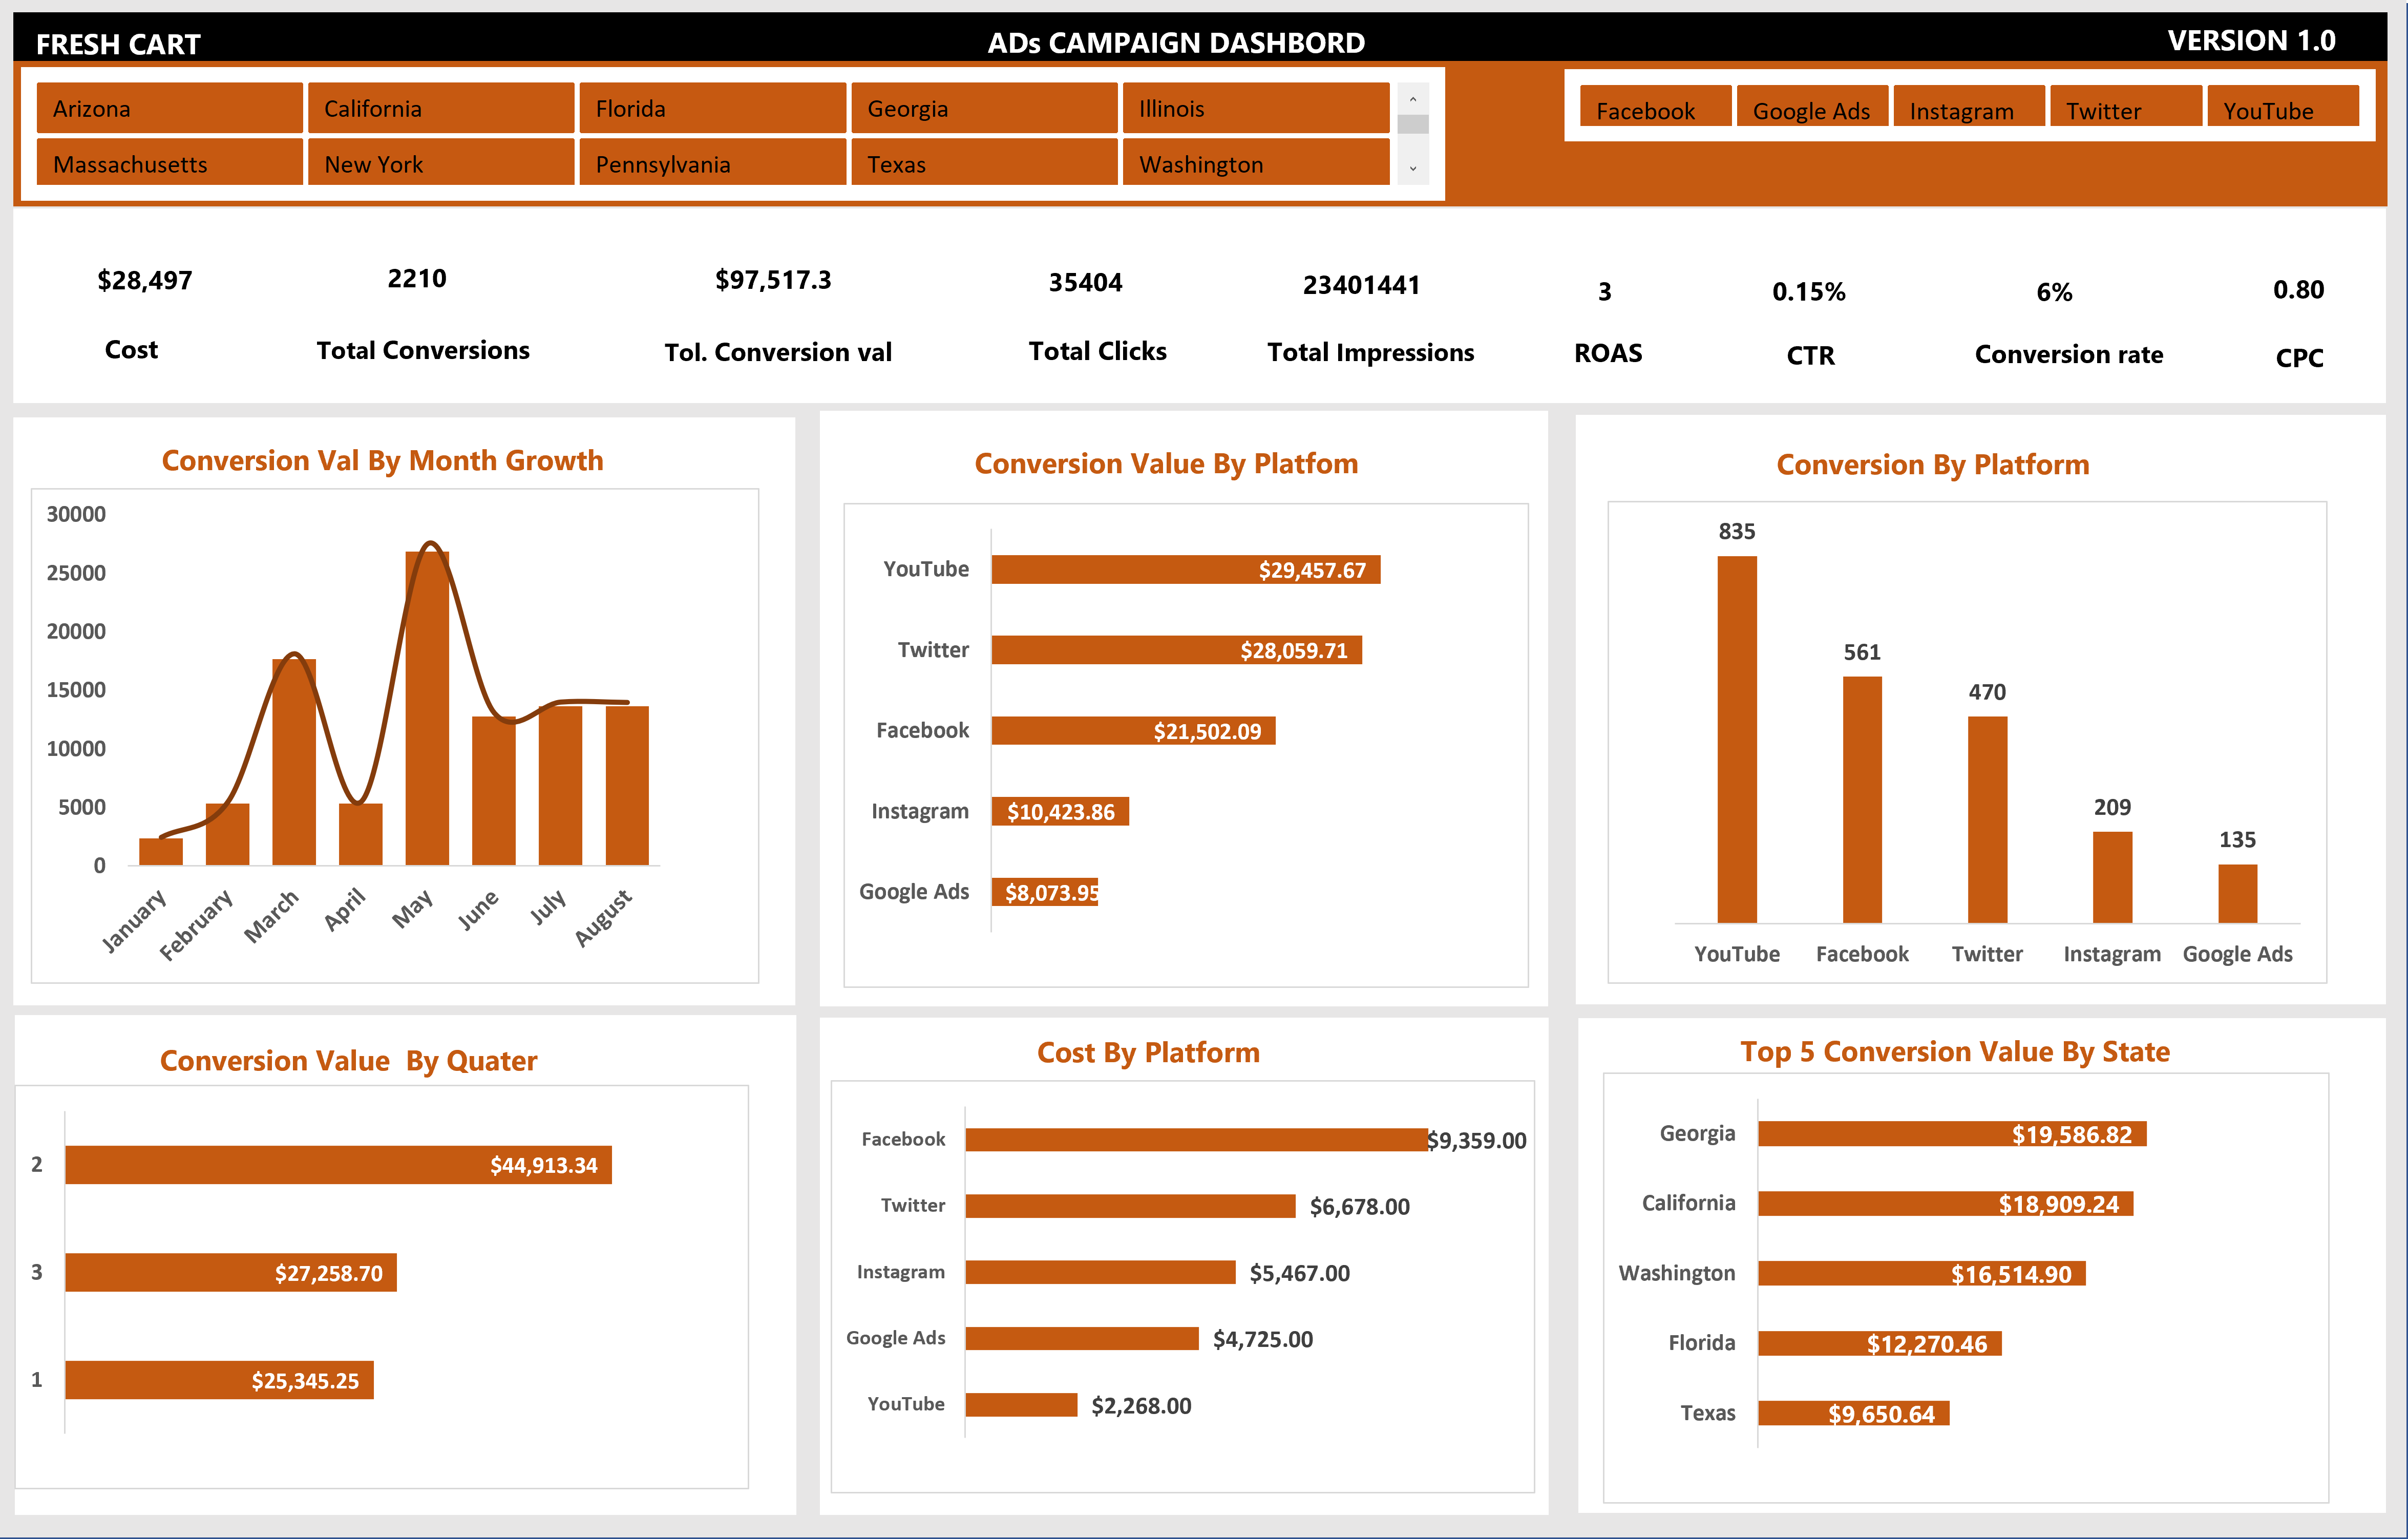
Methodology: To evaluate Fresh Cart Ads Campaign performance, the dataset was downloaded as csv file, I utilized power query for data cleaning and power pivot formula in excel for calculated measures and dashboard report.
Report and
Recommendation: Based
on fresh cart ads campaign performance, I was able to analyze
- Low Return on Ad Spend (ROAS): The ROAS is only 3, which indicates that for every dollar spent on ads, only three dollars are generated in revenue. This suggests inefficiencies in ad spending. Despite achieving 97,517.3 in total conversion value, the return on ad spend is relatively low, suggesting that either ad costs are high, targeting is ineffective, or conversion rates need improvement.
- Poor Click-Through Rate (CTR): The CTR is only 0.15%, meaning a very small percentage of impressions convert into clicks. This implies that ads may not be engaging or well-targeted. With 23,401,441 impressions but only 35,404 clicks, ad creatives or audience targeting strategies may need improvement to increase engagement and drive more traffic.
- High Cost with Low Efficiency in
Some Platforms: Facebook has the highest cost
($9,359) but ranks third in conversion value ($21,502). On the other hand, YouTube
has the lowest cost ($2,268) but the highest conversion value ($29,457). While Facebook
ads consume the most budget, they don’t deliver proportionate conversion value.
A strategic reallocation of the ad budget to more effective platforms like YouTube
and Twitter could improve overall ROAS.
- Unequal Conversion Performance Across States: The top-performing states in conversion value are Georgia, California, and Washington, while others may underperform. Some states contribute significantly to the total conversion value, while others might be underperforming. Analyzing why certain regions convert better can help refine state-level targeting strategies.
- Low Conversion Rate (6%): Out
of 35,404 clicks, only 2,210 conversions were achieved, resulting in a conversion
rate of just 6%. A significant number of
users are clicking the ads but not converting. This suggests potential issues
with landing pages, ad messaging, or audience targeting, which need to be
optimized for better performance.
- Google Ads Underperformance: Google Ads has the lowest conversion value ($8,073.95) and the fewest conversions (135), despite a spend of $4,725. Compared to other platforms, Google Ads is delivering the least return on investment. The ad copy, targeting strategy, or keyword selection might not be effective, and further analysis is required to determine whether to optimize or reallocate budget to better-performing platforms.
Comment (0)
Other projects by Ogbodo Chiamaka Matilda
Talentdigit Resources Limited is a digital training and consulting firm that equips individuals and organizations with digital skills training.
Address: 4 Amurie omanze street (off star time junction) Garki 2, Abuja
For Inquiries Call: +234 (0) 7062274671


Leave your thought here