Mendel Retail Stores Sales Dashboard
Project related images. Click to view
Mendel
Retail Stores Sales Dashboard
Project objective:
To analyze Mendel retail stores sales
report and provide comprehensive
and visual overview of key sales performance metrics across
various dimensions such as time, location, product, and customer demographics.
Aim: To analyze sales performance across time, branches, products, and
customer segments, in order to evaluate profitability, identify growth
opportunities, reduce product returns, and support strategic business
decisions.
Goals:
- Measure and monitor total revenue, expenses, and profit over
selected periods.
- Identify top-performing branches, products, and categories by
profit.
- Evaluate month-over-month and year-over-year profit growth.
- Track order volume and return rates to assess customer
satisfaction.
- Understand customer demographics to align marketing and sales
strategies.
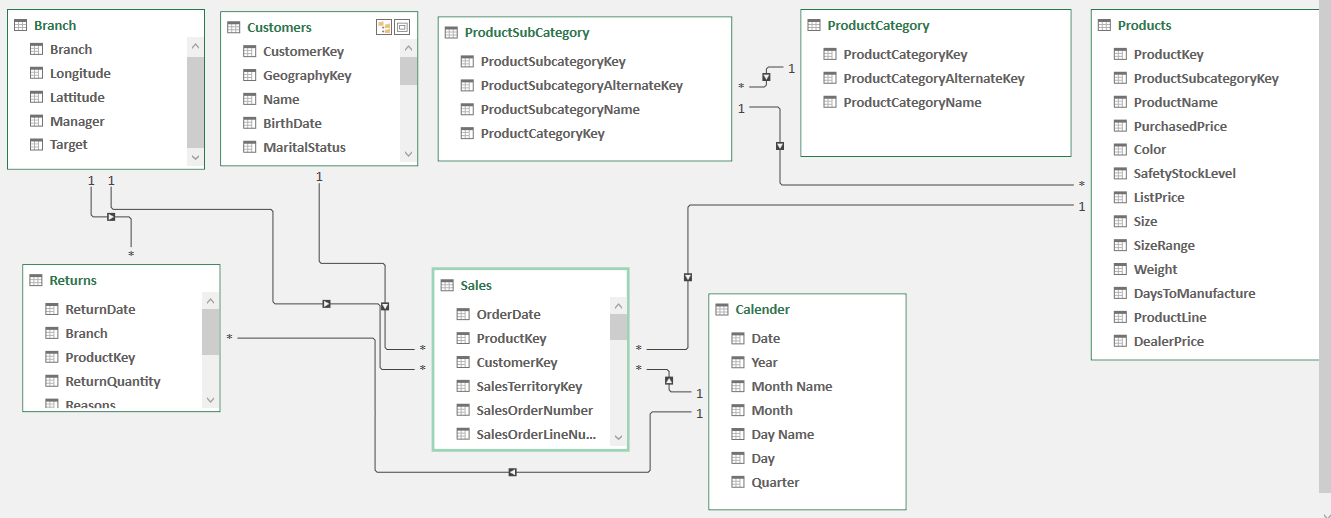
Methodology: To analyze Mendel Retail dataset, I cleaned the dataset using power query, performed data modeling and utilized calculated measures in power pivot in excel,
Report: Based on the Mendel
Retail sales dashboard, I was able to analyze,
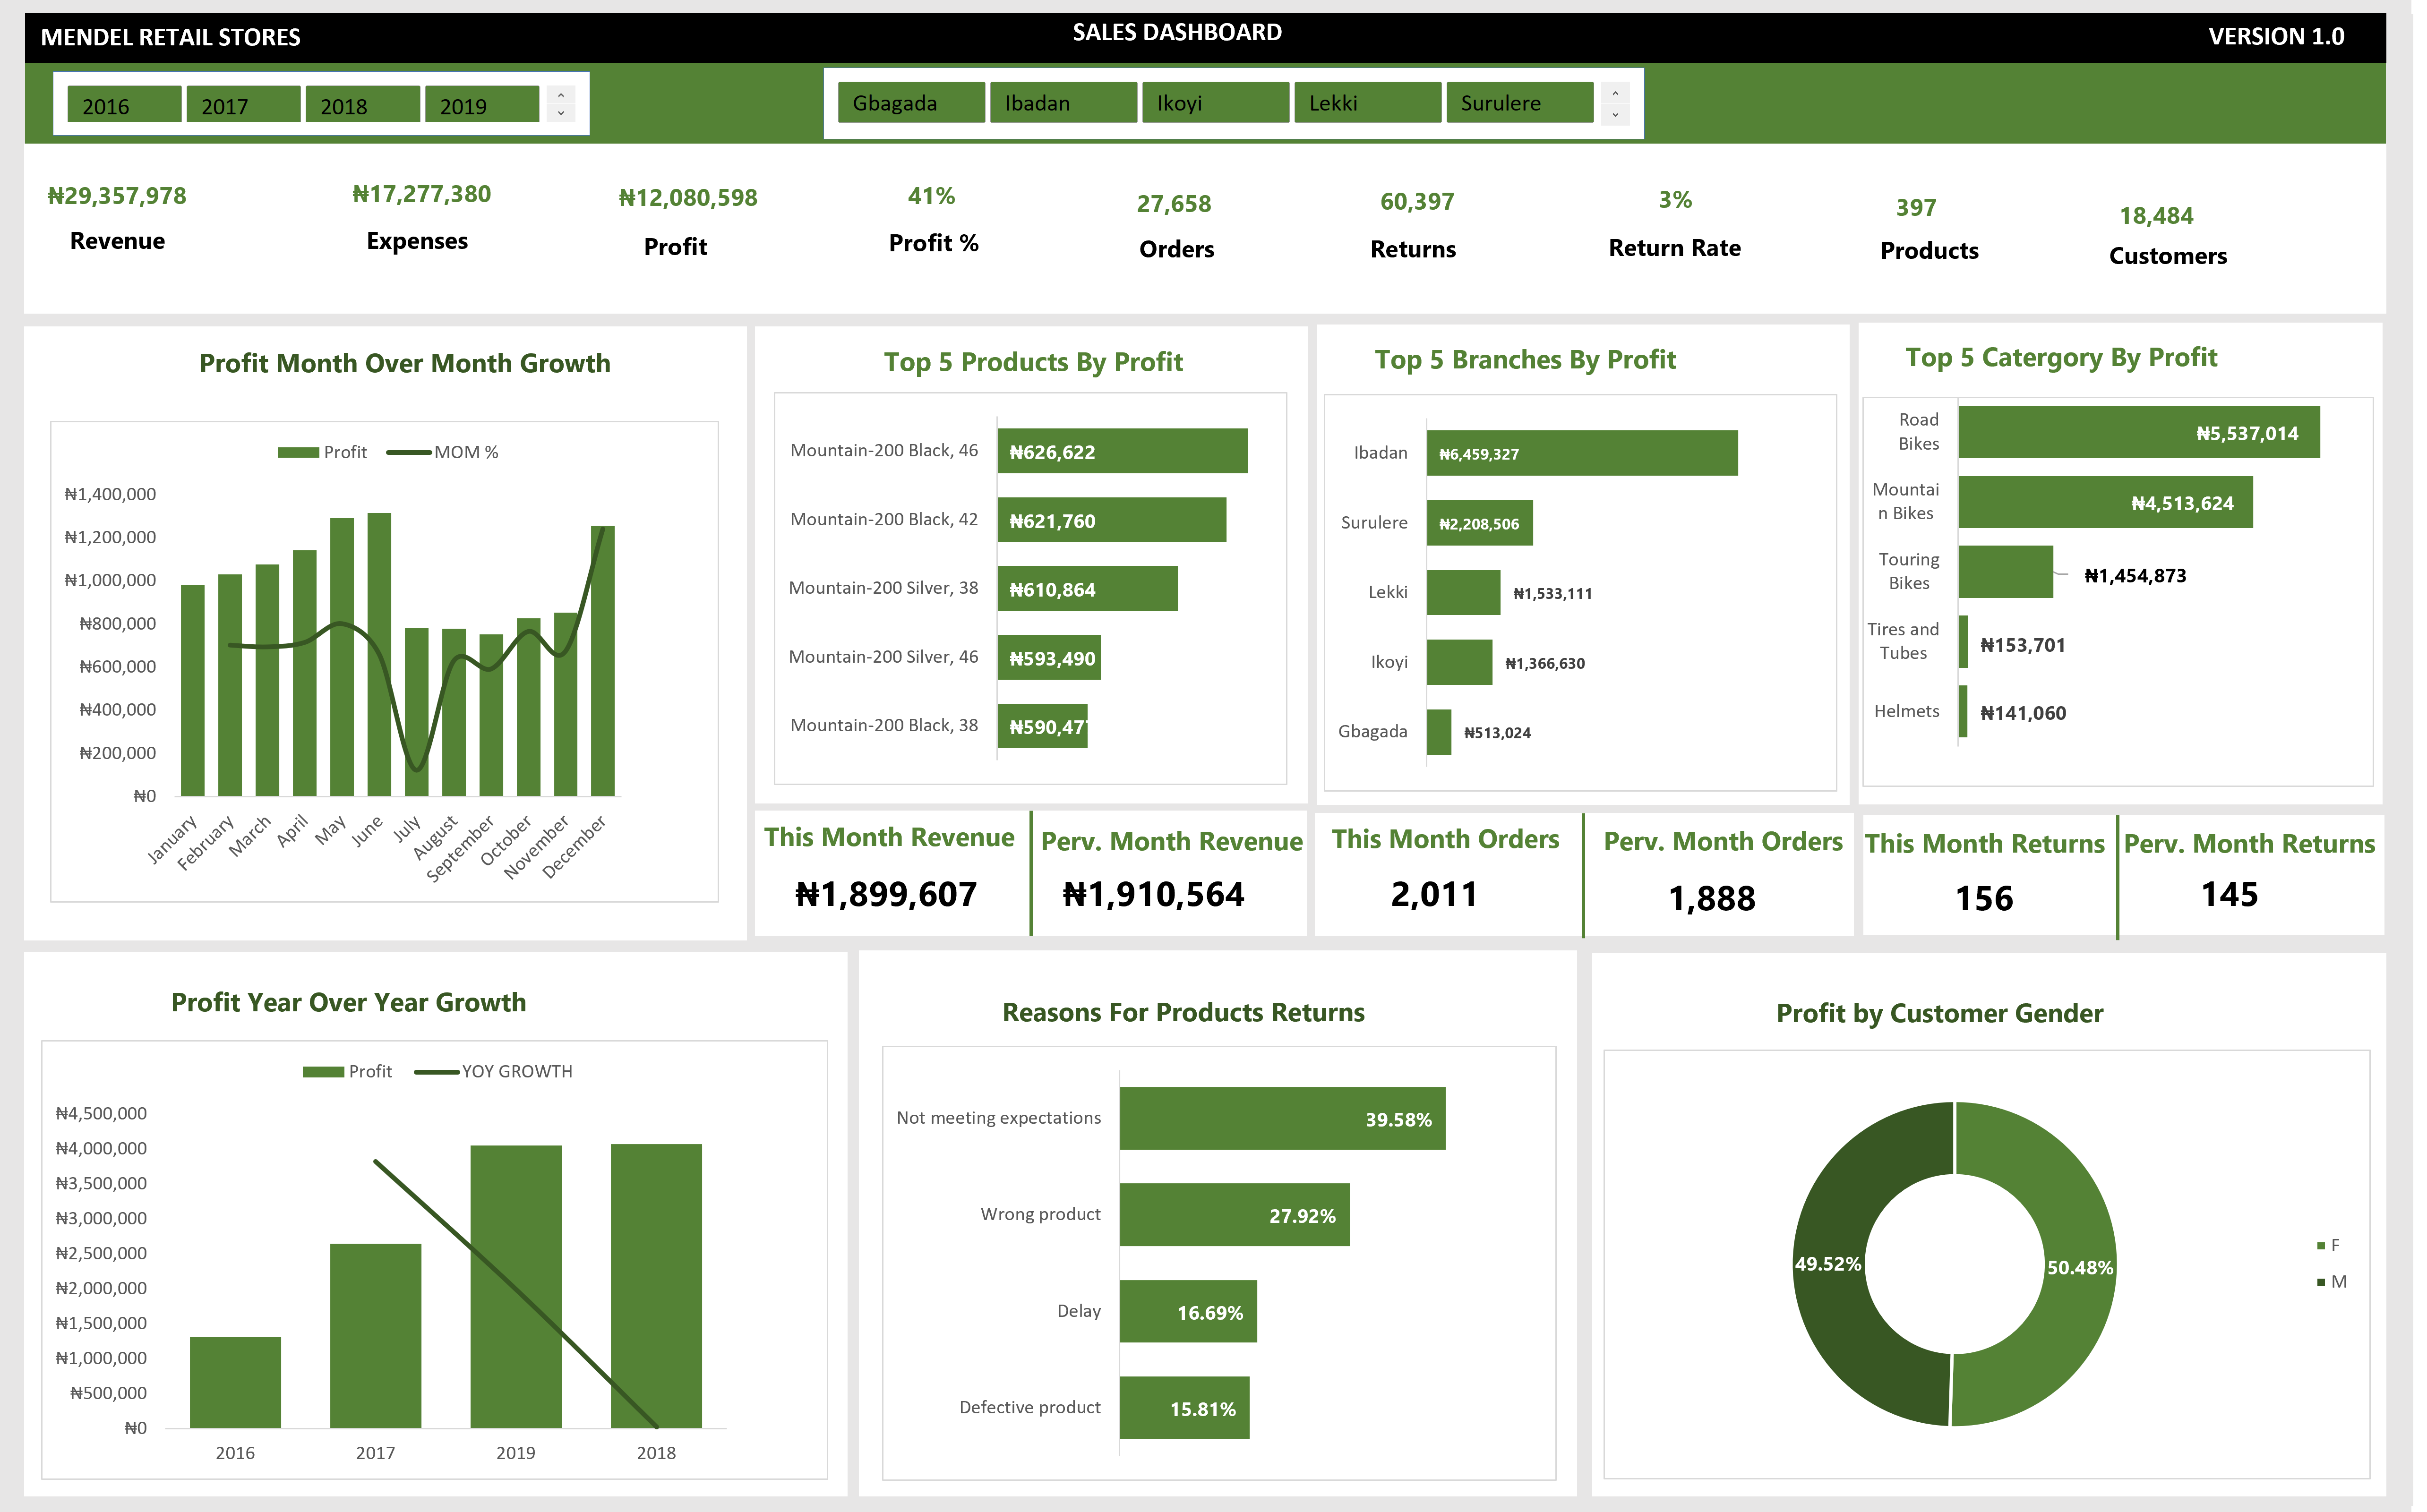
- High Return Rate Impacting Profitability: The return rate is 3%, with 60,397 returns. Identifying the key reasons behind these returns (e.g., product defects, incorrect items, or unmet expectations) could help improve customer satisfaction and profitability.
- Declining Revenue Growth Month Over Month: The previous month's revenue (1,910,564) was higher than this month’s revenue (1,899,607). Investigating the causes of this decline and implementing corrective actions may be necessary.
- Customer Dissatisfaction Leading to Returns: The top reason for product returns is "Not meeting expectations" (39.58%), followed by "Wrong product" (27.92%). Addressing product quality and order accuracy could reduce returns and improve customer retention.
- Branch Performance Disparities: The Ibadan branch generates the highest profit (?6,459,327), while Gbagada has the lowest (?513,024). Evaluating factors like sales strategies, customer demographics, and operational efficiency could help underperforming branches improve.
- Gender-Based Profit Contribution Imbalance: The profit contribution is nearly equal between male (50.48%) and female (49.52%) customers. Further analysis might reveal whether marketing efforts are equally effective or if specific segments are being underserved.
- Product Category Performance Variation: Road Bikes contribute the highest profit (?5,537,014), while Helmets and Tires & Tubes generate the least. Understanding demand trends and optimizing product mix could enhance overall sales performance.
Key Insights:
· Strong Profitability: Profit margin
is 41%, which indicates efficient cost management and healthy sales.
· Top Performing Products and
Branches: The Mountain-200 Black and Silver models dominate the top 5 products
by profit.
· Ibadan branch: significantly
outperforms all others in profit generation.
· High Product Returns: 3% return rate
with 60,397 returns, mostly due to "Not meeting expectations"
(39.58%) and "Wrong product" (27.92%).
· Profit Growth Trends: Monthly profit
shows a dip between July and September before rising again in December.
· YOY profit increased from 2016 to
2018, but YOY growth percentage is declining sharply.
Recommendations:
Reduce
Return Rate: Investigate and improve product
descriptions and images. Implement pre-purchase Q&A, customer reviews, and
clear size/spec guidance.
Boost
Underperforming Branches: Analyze
Gbagada’s customer footfall, stock availability, and marketing strategies. Consider
local promotions, staff training, or rebranding.
Reignite YOY
Growth: Launch new products, enter untapped
markets, or increase online presence to drive new revenue streams.
Diversify
Product Portfolio: Encourage upselling and bundling
strategies for underperforming categories like Helmets and Tires & Tubes.
Capitalize
on High-Profit Categories: Promote
Road Bikes and Mountain Bikes more aggressively through email campaigns, social
media, or discount offers.
Seasonal
Trend Optimization: Revenue peaks in May and December
suggest seasonal opportunities. Align marketing and inventory planning
accordingly to maximize returns.
Implement Customer Segmentation Strategy: Since gender-based contribution is balanced, segment marketing campaigns by behavior, location, and category interest rather than just gender.
Comment (0)
Other projects by Ogbodo Chiamaka Matilda
Talentdigit Resources Limited is a digital training and consulting firm that equips individuals and organizations with digital skills training.
Address: 4 Amurie omanze street (off star time junction) Garki 2, Abuja
For Inquiries Call: +234 (0) 7062274671


Leave your thought here