
ABC Stores Dashboard
Project related images. Click to view
Sales
Dashboard Overview
The
dashboard provides a consolidated view of the company’s sales and profitability
performance. It combines financial indicators, product and branch comparisons,
return analysis, and customer insights so that business performance can be
reviewed from multiple perspectives.
Business
Performance Summary
The
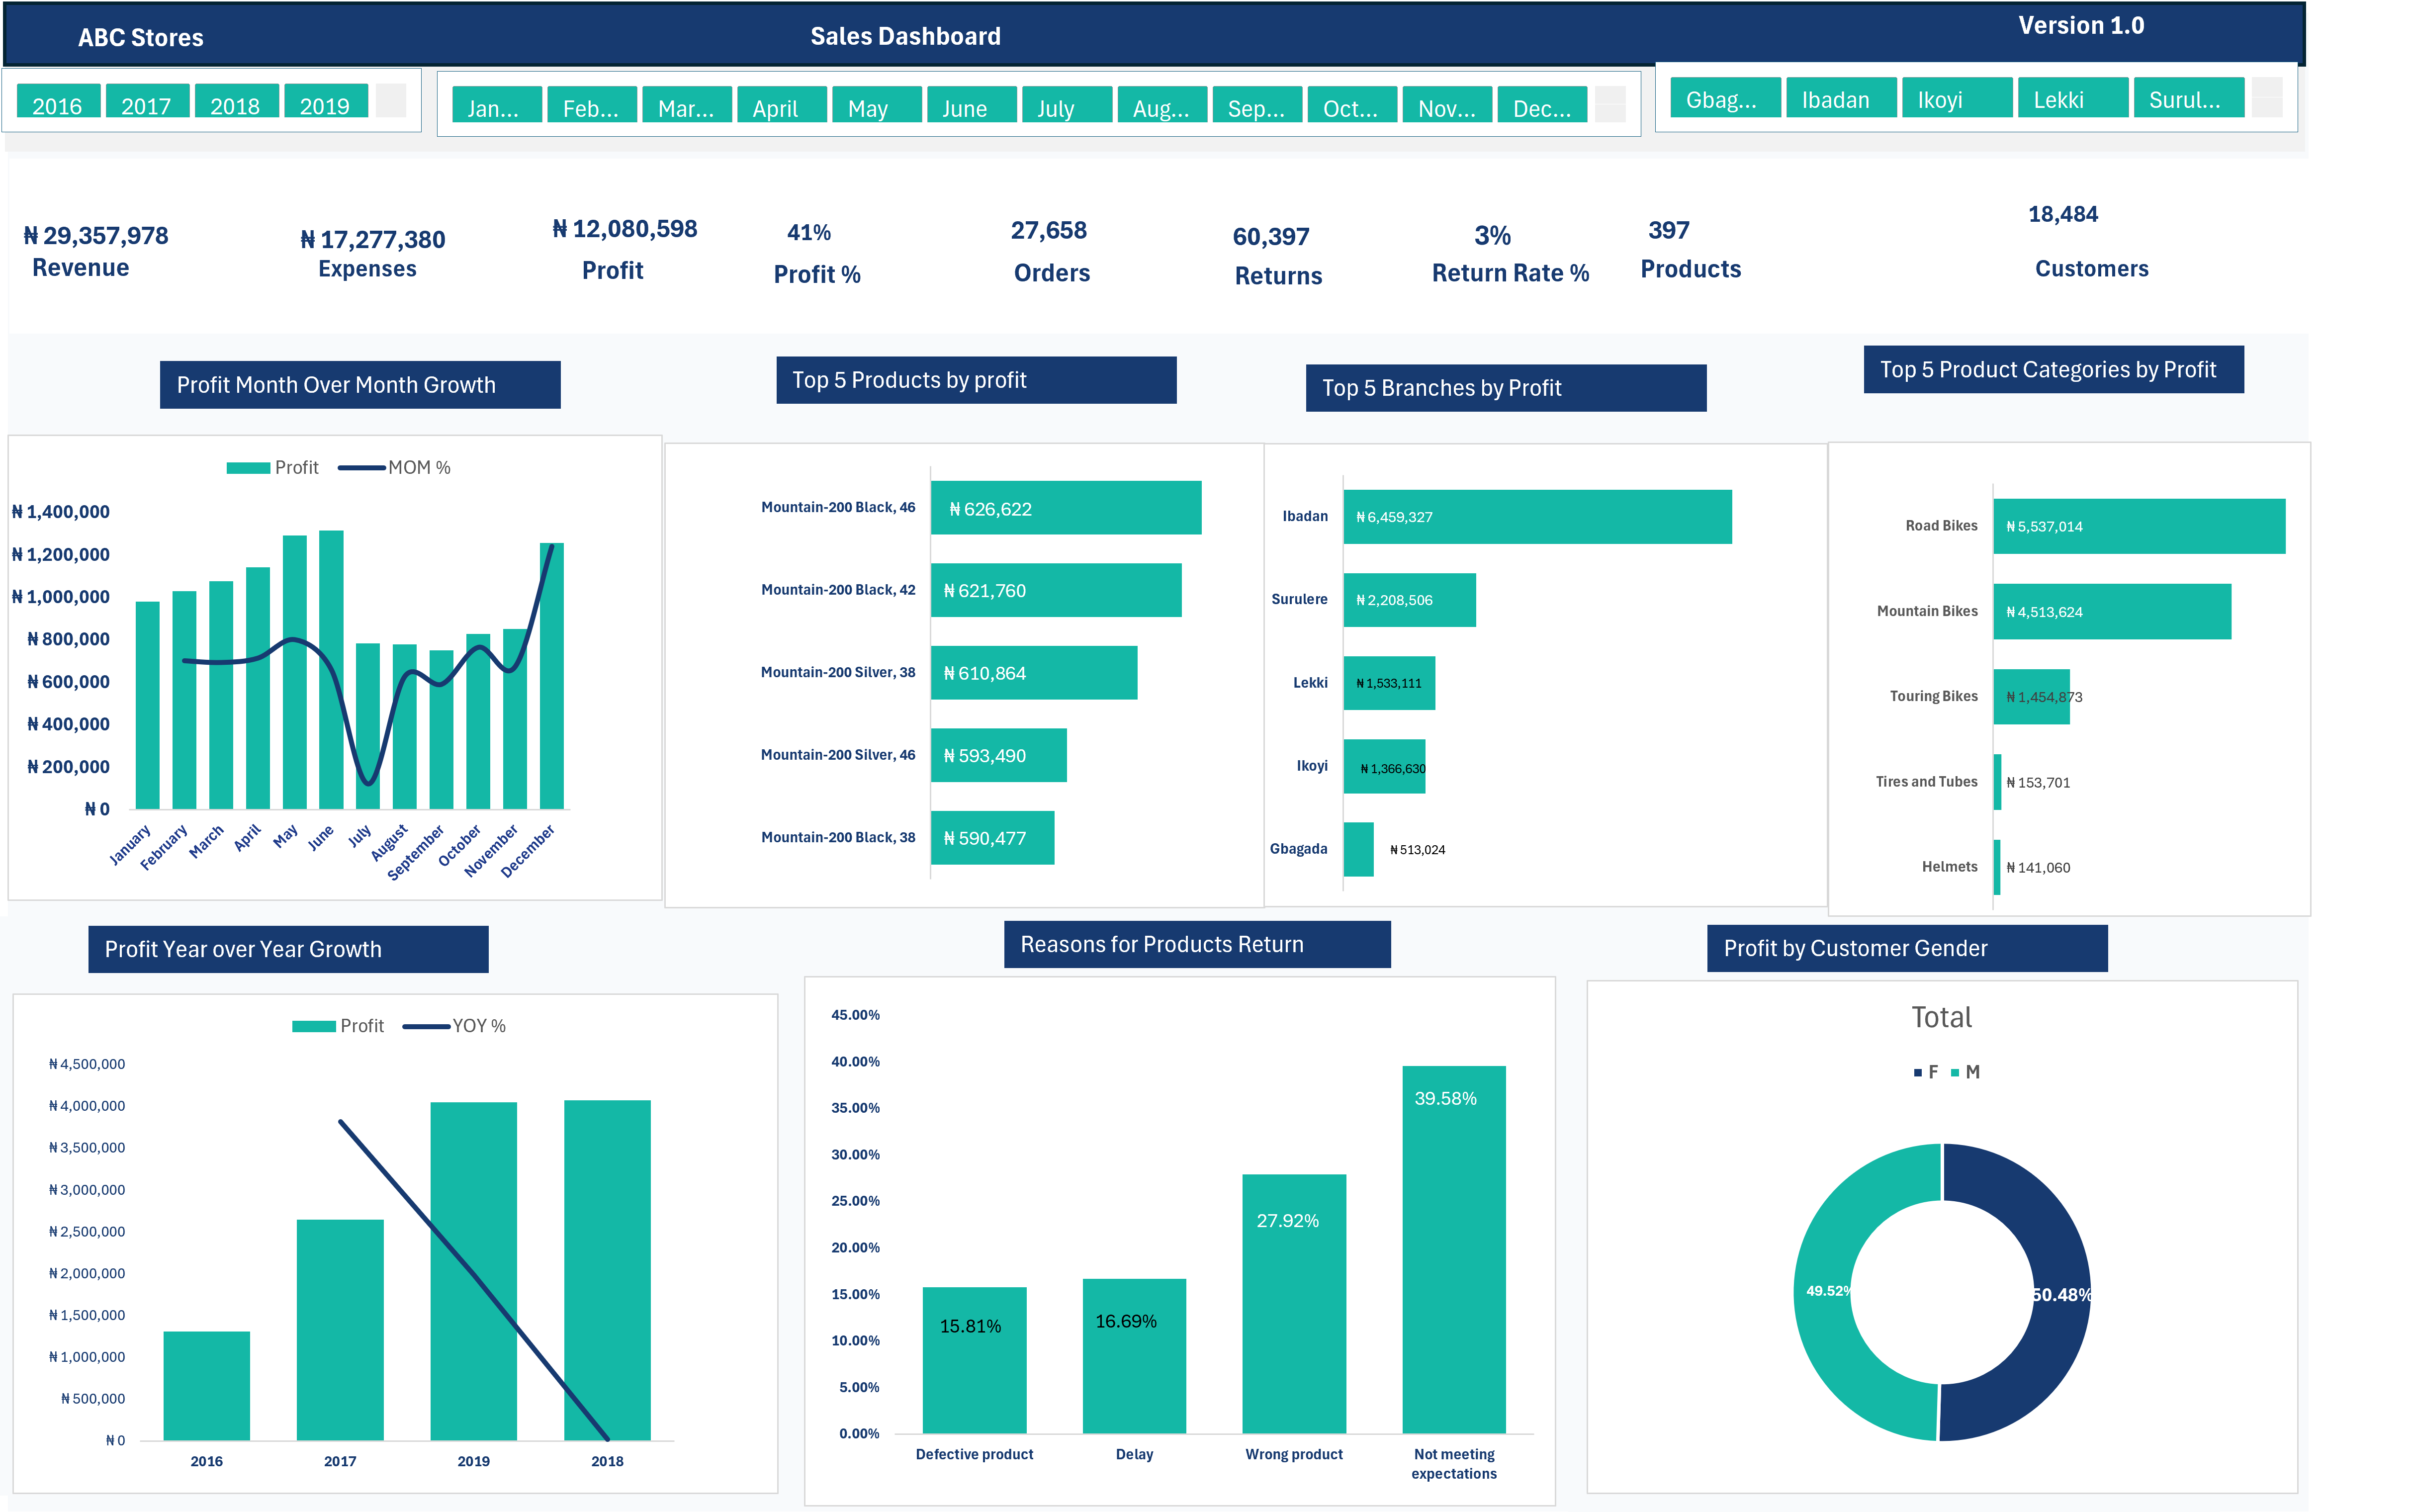
dashboard begins with a set of headline metrics that give a quick overview of
the business:
- Revenue: Shows the total value
generated from sales activities.
- Expenses: Represents the costs incurred
in generating those sales.
- Profit: Indicates the amount retained
after accounting for expenses.
- Profit Margin: Measures show how much of the
revenue is converted into profit.
- Orders: Displays the total volume of
customer orders.
- Returns: Shows the number of products
or orders that were returned.
- Return Rate: Indicates the proportion of
sales associated with returns.
- Products: Represents the number of
products included in the analysis.
- Customers: Shows the customer base
covered by the dashboard.
Financial
Performance Trends
Two
time-based analyses provide insight into how profitability changes over time.
Monthly
Profit Analysis
compares profit across the months of the selected period and incorporates
month-over-month movement. This makes it possible to identify periods of
increasing or decreasing profitability.
Annual
Profit Analysis
compares profit performance across years and presents the year-over-year
movement. This gives a broader view of how the business has developed from one
year to another.
Product
Profitability
The Top
Products by Profit section identifies the individual products generating
the largest profit contributions. This allows the business to examine which
products are having the greatest financial impact and provide useful
information for product-performance monitoring.
Branch
Performance
The Top
Branches by Profit chart compares branches according to the profit they
generate. It helps reveal differences in branch-level performance and shows
where a larger share of profitability is being produced.
Product
Category Analysis
The
dashboard further groups products into major categories and compares their
profitability. Categories such as road bikes, mountain bikes, touring bikes,
tires and tubes, and helmets can be examined to understand which areas of
the product portfolio contribute most to profit.
Return
and Customer Experience
The Product
Return Reasons chart breaks down returned products according to the reason
for the return. The dashboard considers factors such as:
- Defective products
- Delivery delays
- Incorrect products
- Products not meeting customer
expectations
This
analysis can help highlight areas where product quality, fulfillment, or
customer expectations may require further investigation.
Customer
Profit Contribution
The Profit
by Customer Gender visualization compares the share of profit associated
with male and female customers. This provides a simple view of how
profitability is distributed across the customer groups represented in the
dataset.
Dashboard
Interactivity
Users can
refine the analysis using interactive filters for year, month, and branch.
Selecting different filter combinations updates the dashboard visuals, allowing
users to examine performance for a particular period, branch, or combination of
business conditions.
Overall,
Purpose
Overall,
the dashboard is designed to move from a high-level view of business
performance to more detailed analysis of time trends, products,
branches, product categories, returns, and customers. This structure makes
it easier to identify important changes in performance and investigate the
areas contributing to overall profitability.
Comment (0)
Other projects by Ayuba

Talentdigit Resources Limited is a digital training and consulting firm that equips individuals and organizations with digital skills training.


Leave your thought here