
DANGATA STORES
Project related images. Click to view
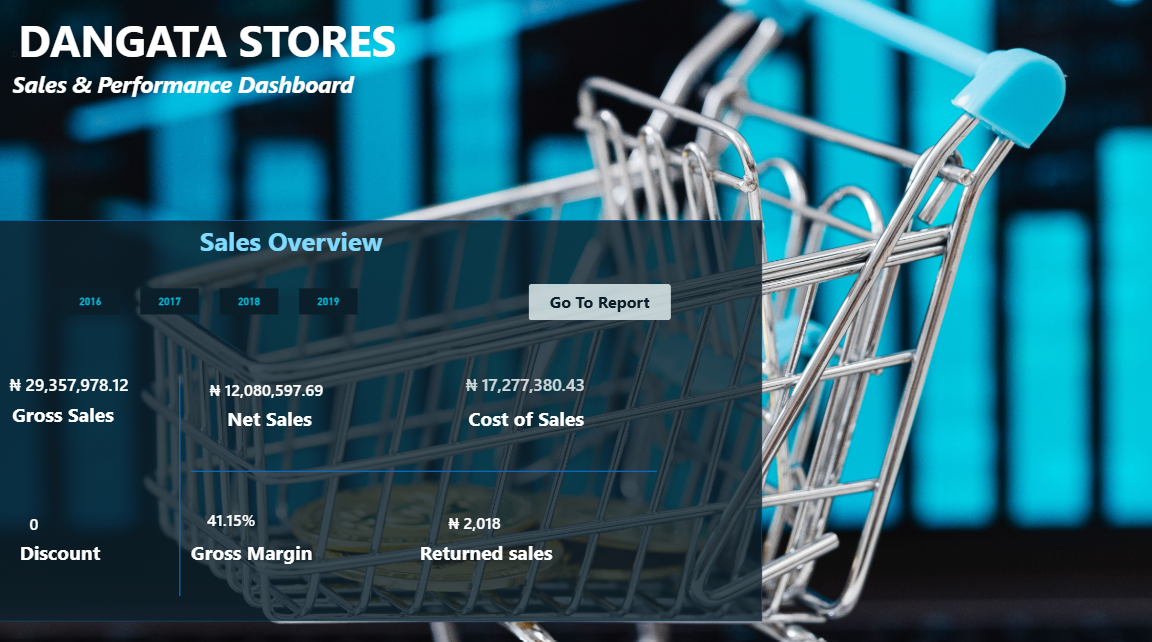
Developed an interactive Sales & Performance Dashboard in Microsoft Power BI to analyze retail sales performance and provide actionable business insights for Dangata Stores. The dashboard consolidates sales data across multiple years, enabling management to monitor revenue trends, profitability, product performance, and overall business health.
Objectives
* Analyze historical sales performance from 2016 to 2019.?
* Track key business metrics such as Gross Sales, Net Sales, Cost of Sales, Gross Margin, Discounts, and Returned Sales.?
* Identify performance trends and profitability drivers.?
* Create an intuitive and interactive dashboard for executive decision-making.?
Tools & Technologies
* Microsoft Power BI?
* Power Query (Data Cleaning & Transformation)?
* DAX (Data Analysis Expressions)?
* Data Modeling & Visualization?
Key Features
* Interactive year-based filtering (2016-2019)?
* KPI cards highlighting critical business metrics?
* Sales performance overview dashboard?
* Profitability analysis through Gross Margin calculations?
* Return and discount tracking for operational efficiency?
* Dynamic navigation and report interaction?
Data Analysis Performed
* Sales trend analysis across multiple years?
* Revenue and profitability assessment?
* Cost-to-sales performance evaluation?
* Gross Margin performance measurement?
* Returned sales impact analysis?
* Comparative yearly performance analysis?
Key Insights
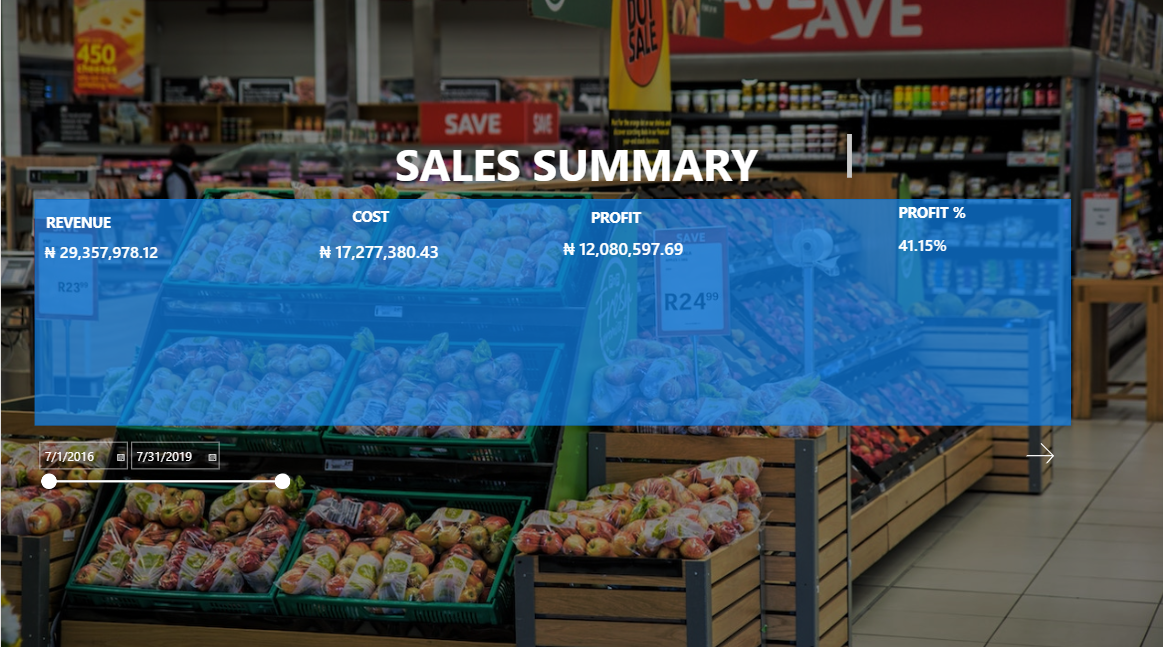
* Achieved Gross Sales of ?29.36M for the selected period.?
* Recorded Net Sales of ?12.08M after accounting for relevant deductions.?
* Cost of Sales stood at ?17.28M, providing visibility into operational spending.?
* Maintained a 41.15% Gross Margin, indicating a healthy profitability level.?
* Return rates were minimal with only ?2,018 in returned sales.?
* No discounts were recorded during the selected reporting period.?
Outcome: The dashboard transformed raw sales data into a clear, visual decision-support tool, enabling stakeholders to quickly assess business performance, identify growth opportunities, and make data-driven decisions.
Comment (0)
Other projects by Ayuba

Talentdigit Resources Limited is a digital training and consulting firm that equips individuals and organizations with digital skills training.


Leave your thought here