
Sales Summary Dashboard
Project related images. Click to view
An
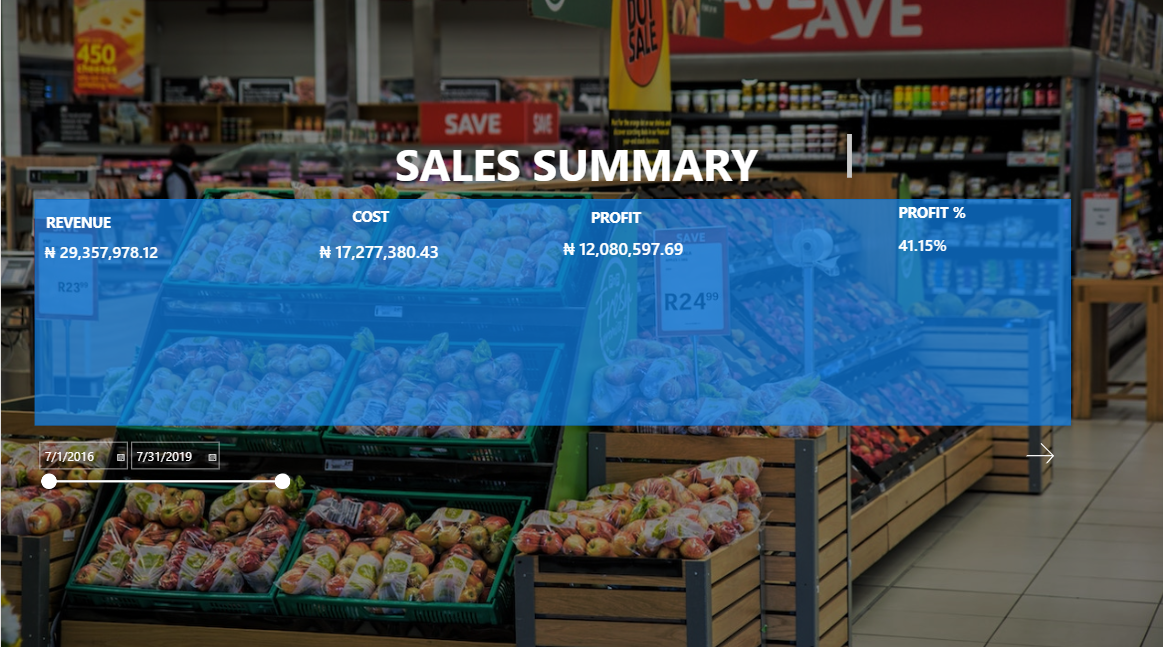
interactive Sales Summary Dashboard built with Microsoft Power BI to
provide a clear overview of business performance and profitability. The
dashboard brings key financial metrics together, including Revenue, Cost,
Profit, and Profit Margin, allowing users to quickly understand the
financial position of the business.
Each
metric provides a different view of performance: Revenue reflects total
sales generated, Cost highlights the expenses associated with sales, Profit
shows the earnings after costs, while Profit Margin measures the
percentage of revenue retained as profit.
An
interactive date filter was also incorporated to allow users to explore
performance across different periods and identify changes over time.
Comment (0)
Other projects by Ayuba

Talentdigit Resources Limited is a digital training and consulting firm that equips individuals and organizations with digital skills training.


Leave your thought here