
Healthcare Visits Analytics
Project related images. Click to view
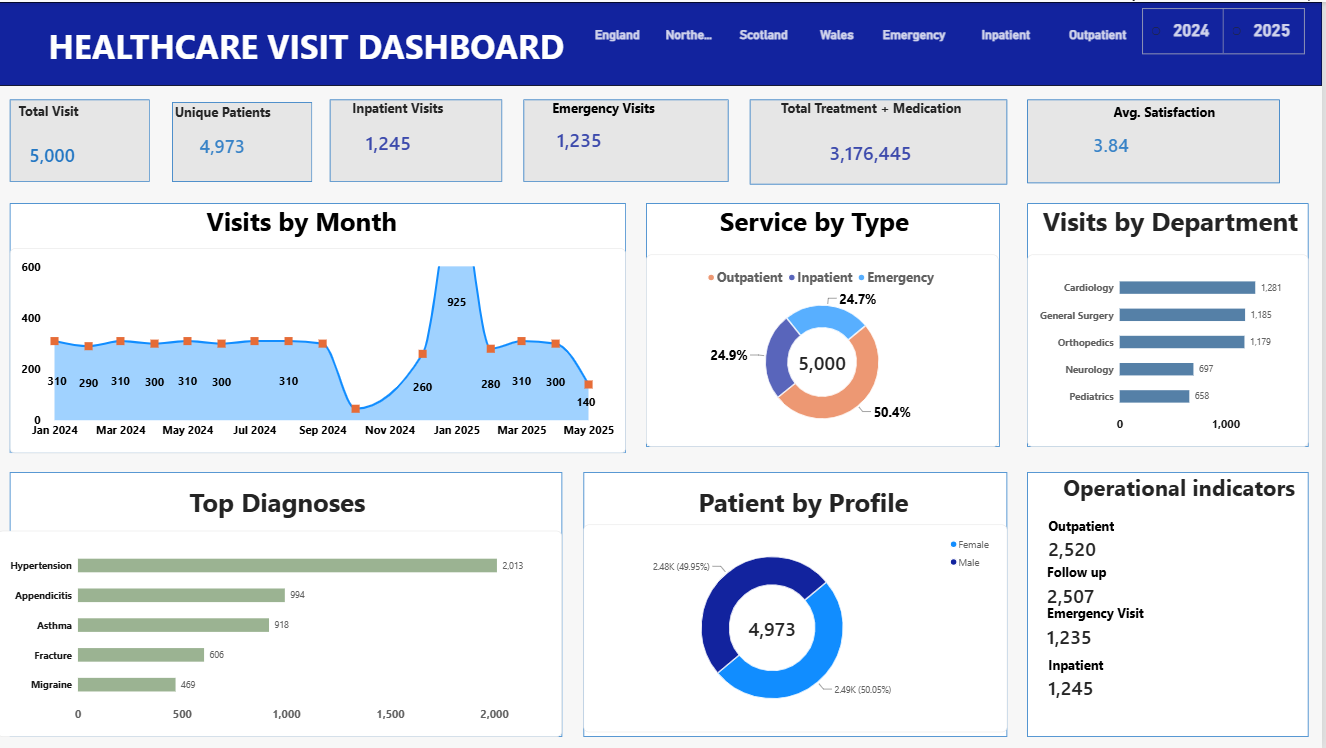
I developed an interactive Healthcare Visits Analytics Dashboard using Microsoft Power BI to transform raw healthcare data into meaningful insights for monitoring patient activity and healthcare service performance.
The dataset contained 5,000 healthcare visit records involving 4,973 unique patients, covering the period from January 2024 to May 2025. The project involved data cleaning and preparation, data modeling, relationship management, calendar creation, DAX calculations, and interactive dashboard design.
The dashboard provides insights into monthly visit trends, service utilization, departmental workload, top diagnoses, patient gender distribution, emergency and inpatient visits, follow-up activity, treatment and medication costs, and patient satisfaction.
Key Findings
- 5,000 total healthcare visits
- 4,973 unique patients
- 2,520 outpatient visits
- 1,245 inpatient visits
- 1,235 emergency visits
- 2,507 visits with follow-up recorded
- 3,176,445 total treatment and medication cost
- 3.84/10 average patient satisfaction
- Cardiology recorded the highest departmental visits with 1,281
- Hypertension was the most frequently recorded diagnosis with 2,013 visits
The dashboard enables users to interactively filter the data by year, location, service type, and department, making it easier to identify trends, compare healthcare services, monitor workload, and support data-driven healthcare decision-making.
Comment (0)
Other projects by Ayuba


Talentdigit Resources Limited is a digital training and consulting firm that equips individuals and organizations with digital skills training.


Leave your thought here