
K-Square Store Sales Dashboard
Project related images. Click to view
K-Square Store Sales Dashboard | Excel
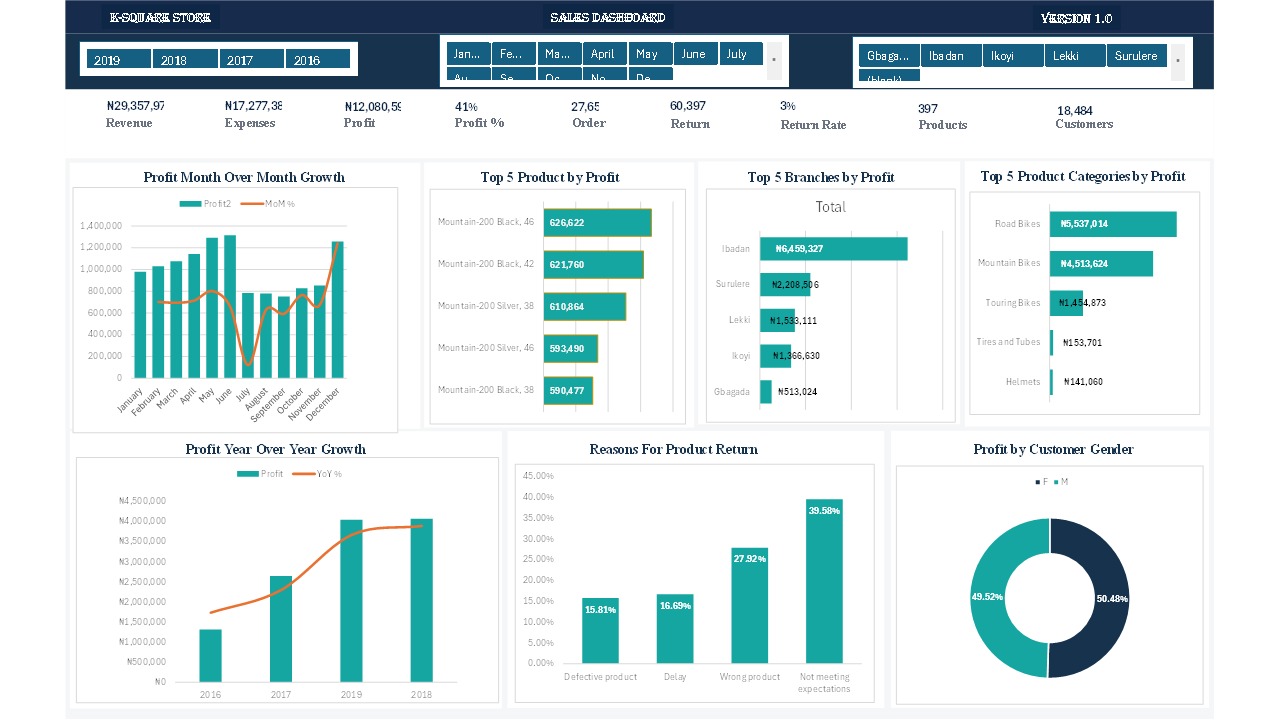
Developed an interactive Excel sales dashboard to analyze the performance of a multi-branch retail business using sales data from 2016–2019. The dashboard consolidates key business metrics into a single, user-friendly view, making it easier to monitor revenue, profitability, orders, returns, and overall sales performance.
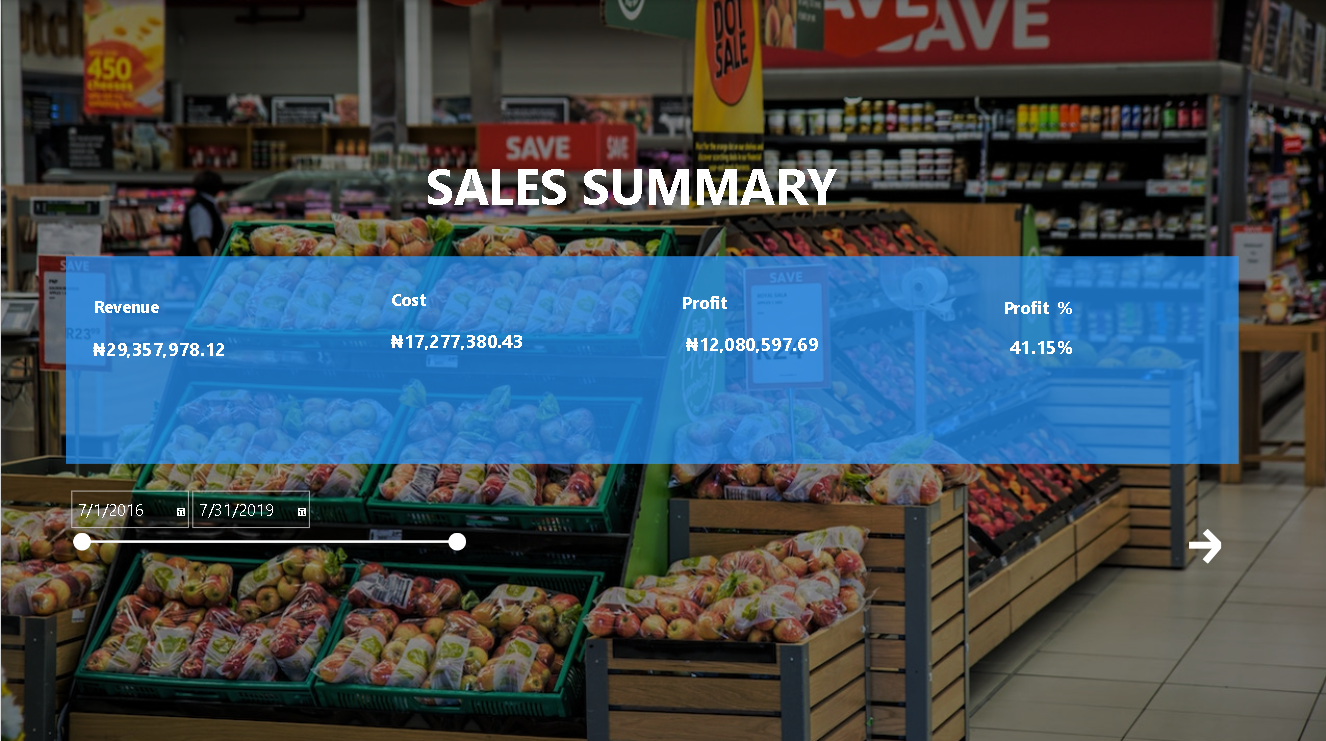
The analysis revealed ?29.4M in revenue, ?12.1M in profit, a 41% profit margin, 27,650 orders, and a 3% return rate. Interactive slicers allow users to explore performance by year, month, and branch, providing a more dynamic way to identify trends and compare business performance.
Key findings included Ibadan as the highest-performing branch, with Road and Mountain Bikes leading product categories. The analysis also highlighted a significant profit decline in July, followed by a recovery toward year-end. Return analysis showed that “Not Meeting Expectations” and “Wrong Product” accounted for 67% of returns, highlighting potential opportunities to improve product descriptions, customer expectations, and order fulfillment.
Tools & Skills: Microsoft Excel, PivotTables, PivotCharts, Slicers, Data Modeling, Data Analysis, KPI Development, and Dashboard Design.
Comment (0)
Other projects by Ismail


Talentdigit Resources Limited is a digital training and consulting firm that equips individuals and organizations with digital skills training.


Leave your thought here