
Royal Bank Loan Analysis
Project related images. Click to view
Loan Portfolio Dashboard: Turning 38,576 Loans into Clear Business Insight
Banks lend money every day, but leadership needs to see at a glance whether that lending is paying off and where the risk sits. For this project, I built an interactive loan portfolio dashboard for Royal Bank that answers those questions in one place.
I started with a raw loan dataset and used Excel to validate and clean the data and build PivotTables to explore it. I then moved to Power BI, where I created DAX measures for the key metrics and designed a four-page report: Executive View, Loan Performance, Credit Risk Analysis, and Customer Analysis. Navigation buttons let a user move between pages easily.
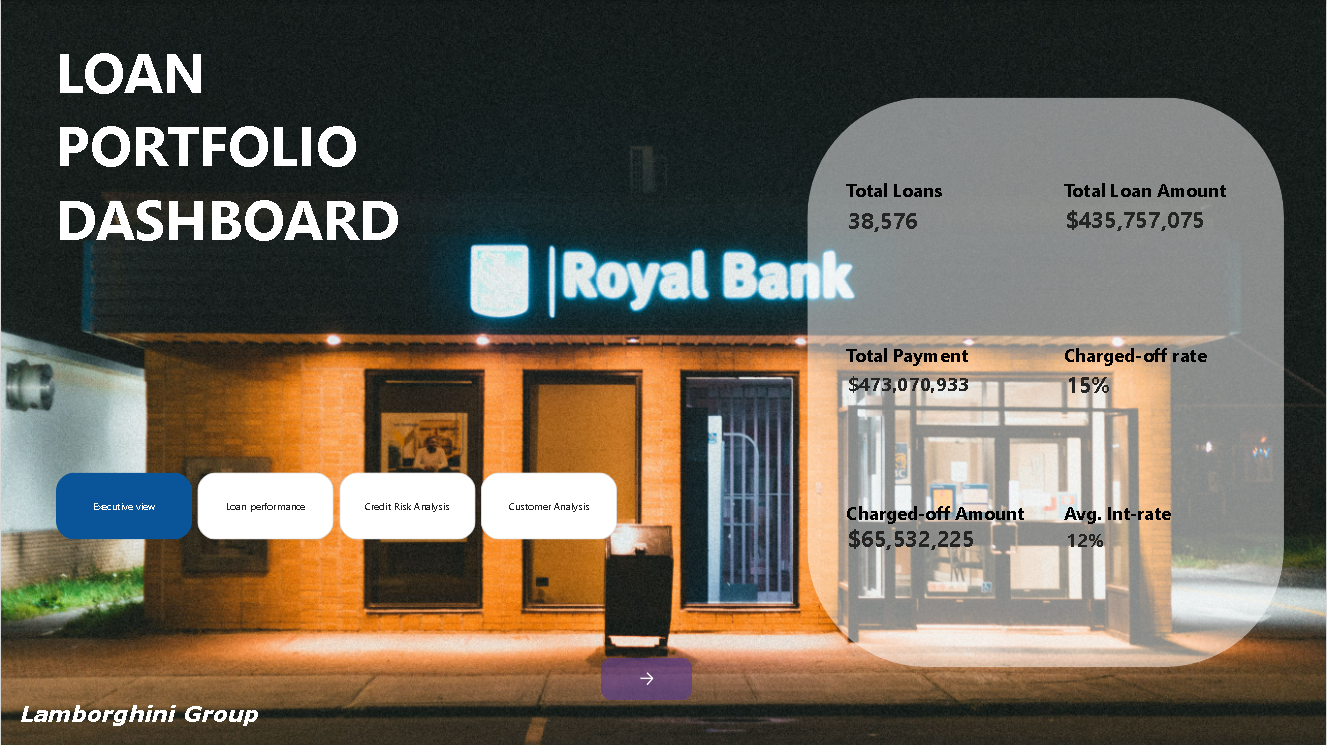
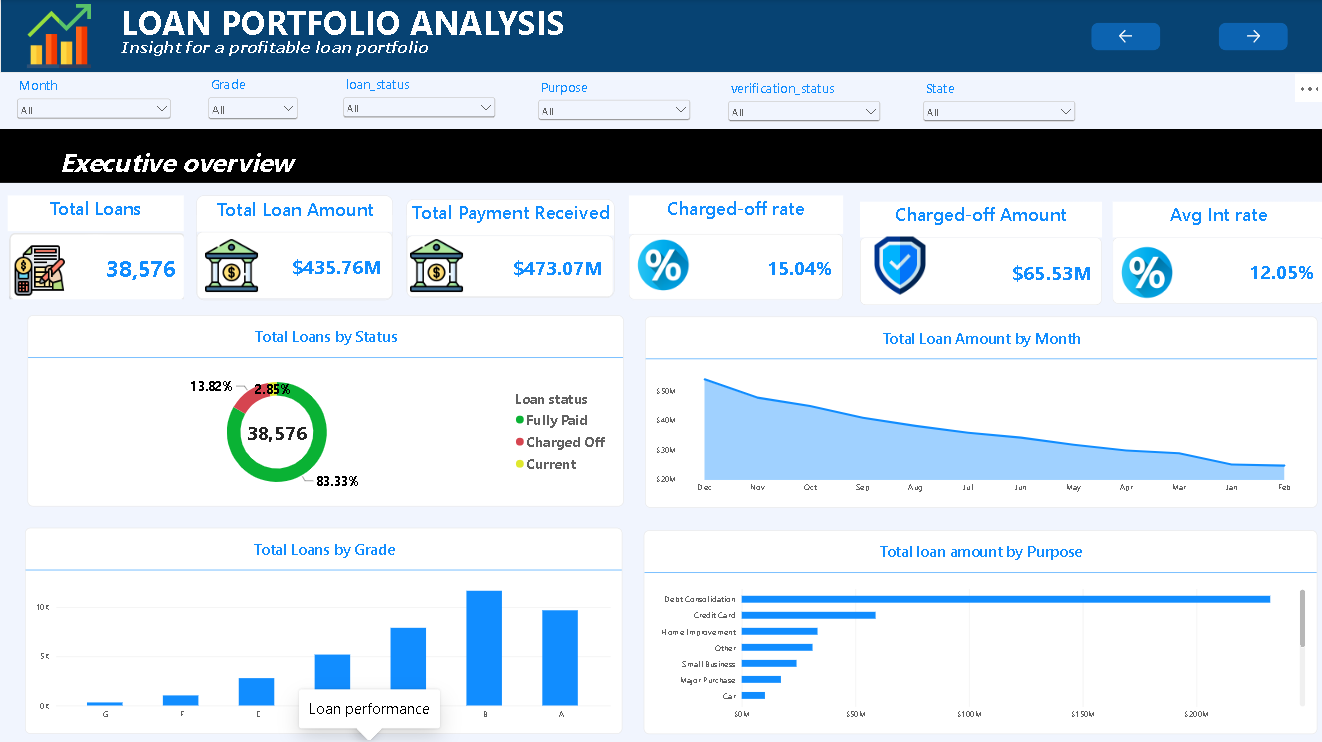
The Executive View gives leadership the headline numbers right away. The portfolio covers 38,576 loans worth $435.76M, and total payments received came to $473.07M, a net return of about $37M. The average interest rate is 12%. The portfolio’s main risk is also clear: the charged-off rate is 15%, with charged-off loans totaling $65.53M.
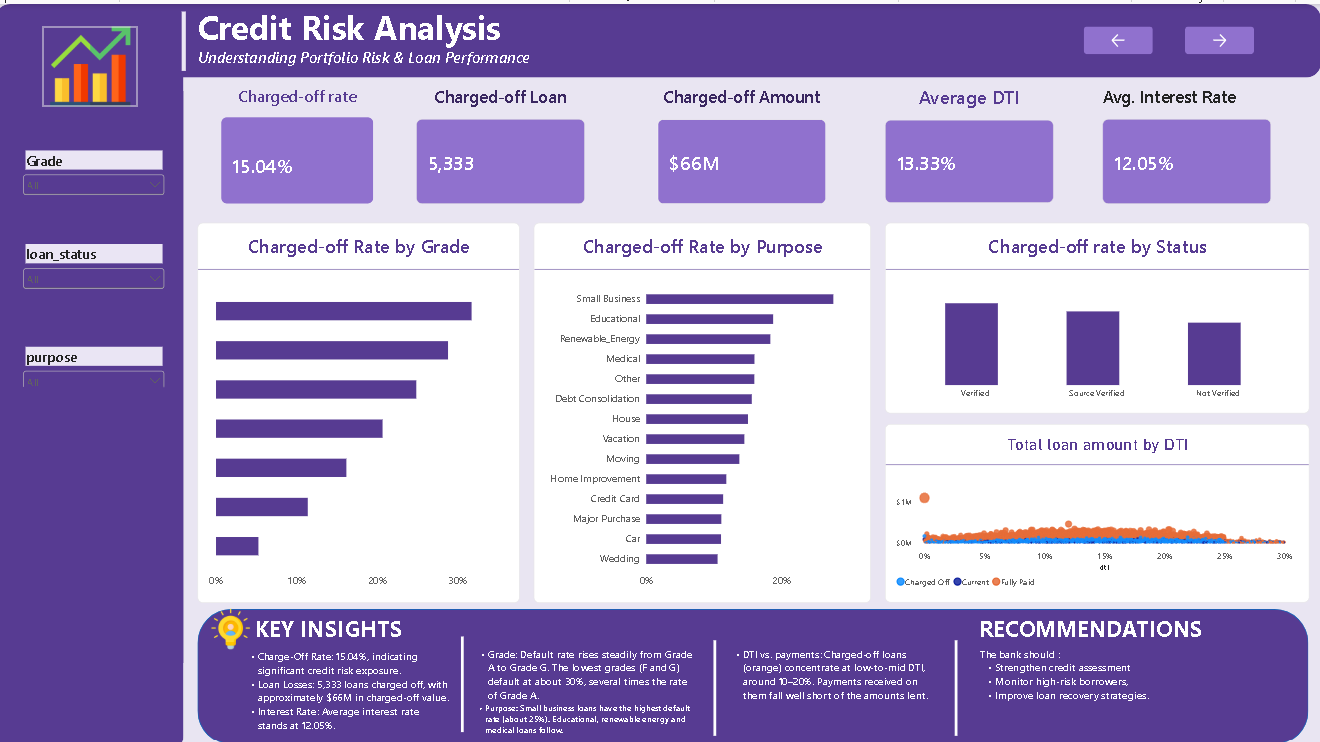
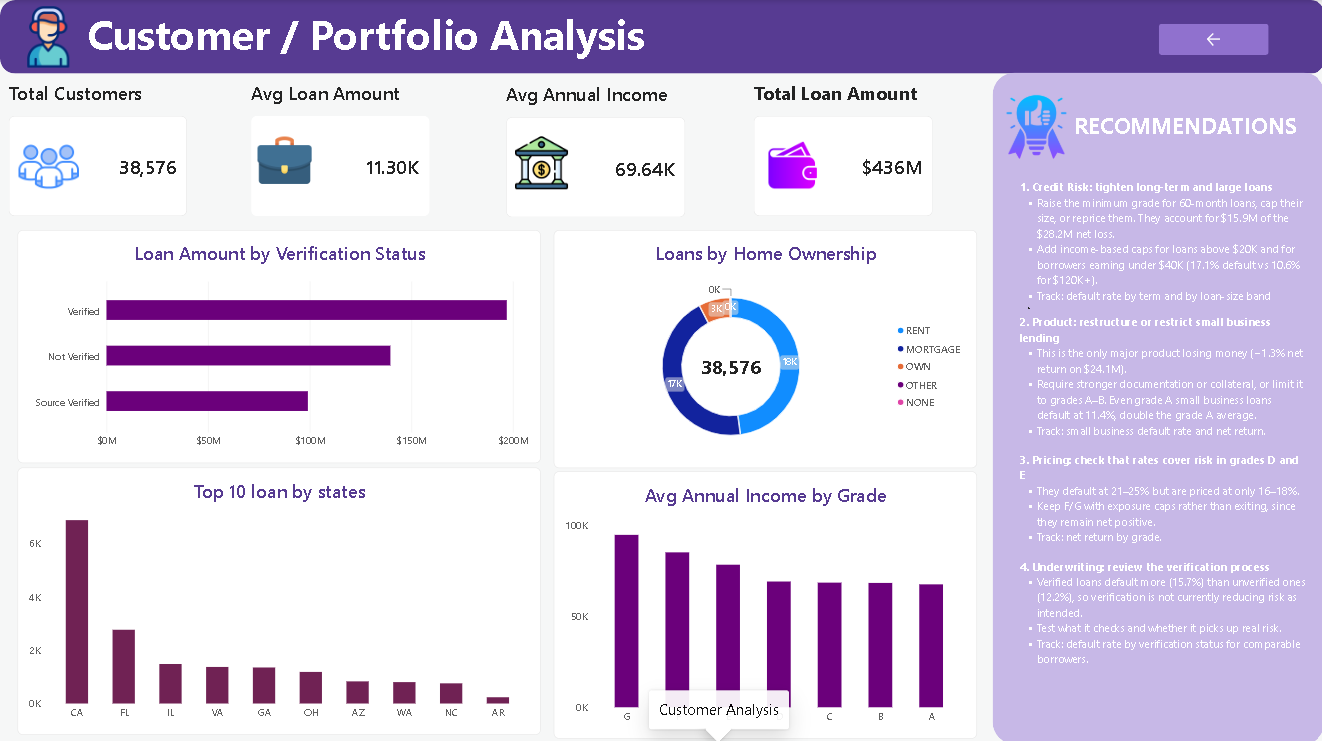
Together, these figures show a portfolio that is profitable overall, with credit risk as the main area to manage. The remaining pages let decision-makers look into the drivers behind these numbers, including loan performance over time, risk by borrower profile, and customer segments.
Skills demonstrated: data cleaning and validation, PivotTable analysis, DAX, dashboard design, KPI development, and communicating financial insights.
Comment (0)
Other projects by Ismail


Talentdigit Resources Limited is a digital training and consulting firm that equips individuals and organizations with digital skills training.


Leave your thought here