
K-Square Store Sales Summary

Project related images. Click to view
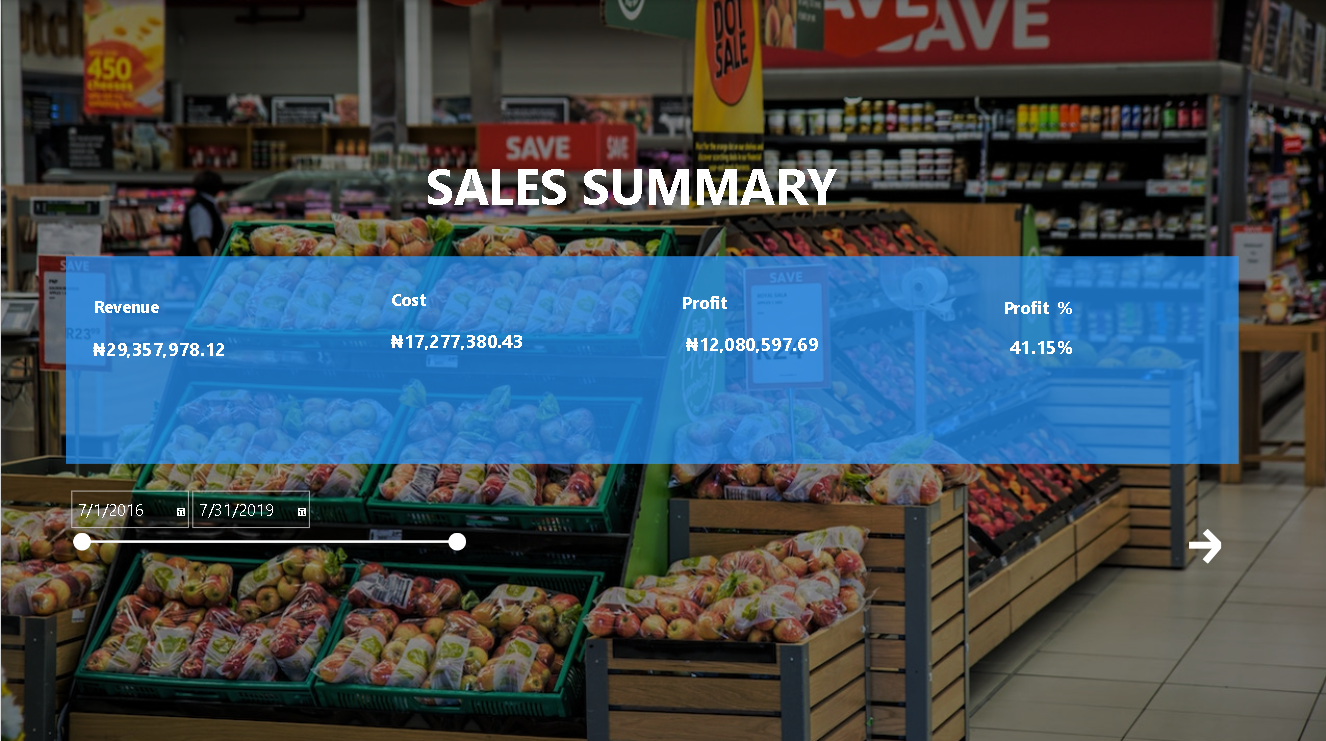
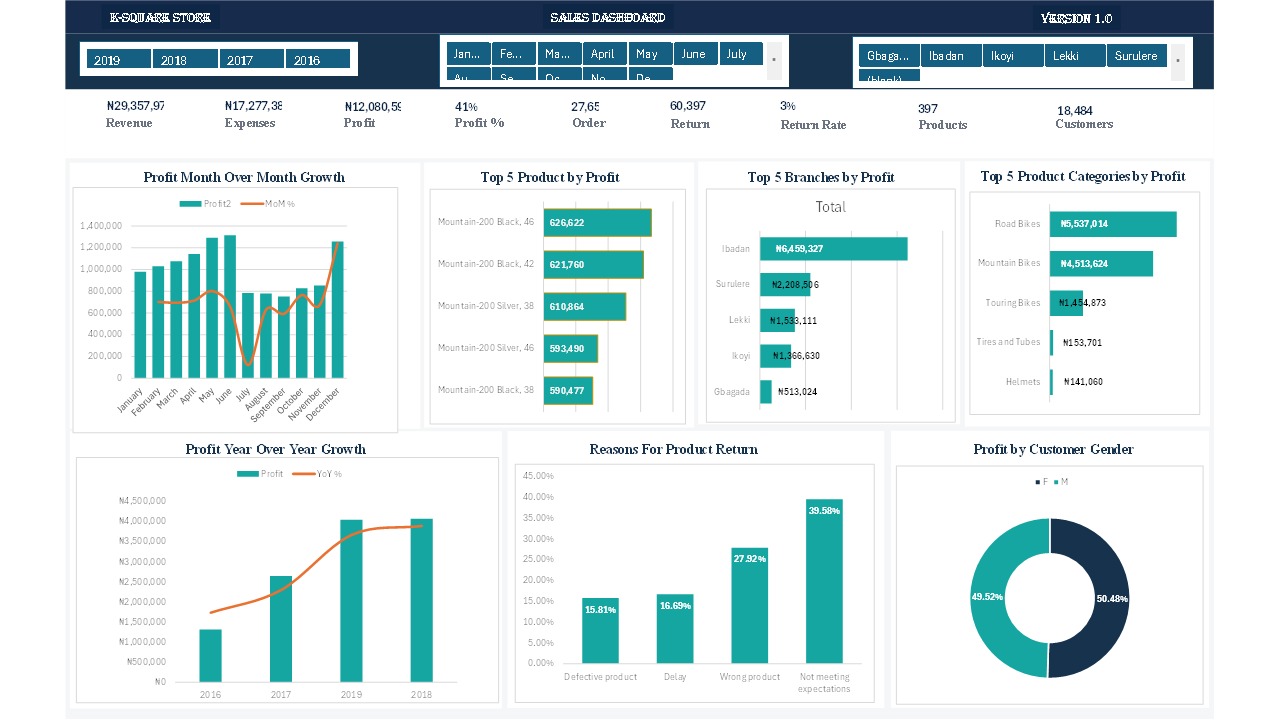
I built an interactive sales dashboard for a retail business, covering 2016-2019. It brings revenue, expenses, profit, discounts and returns into one view, with a year selector and a branded landing page that leads into the full report.
Key results
- Revenue was ?29.4M against expenses of ?17.3M, leaving a profit of ?12.1M (41% margin).
- No discounts were given, and the return rate was only 3%.
- Expenses took about 59% of revenue, so cost control is the main way to lift profit.
Skills: data cleaning, KPI design, DAX/Excel formulas, data visualization, dashboard navigation
Comment (0)
Other projects by Ismail

Talentdigit Resources Limited is a digital training and consulting firm that equips individuals and organizations with digital skills training.


Leave your thought here