
K-Square Store Sales Summary
Project related images. Click to view
K-Square Store Sales Summary | Power BI
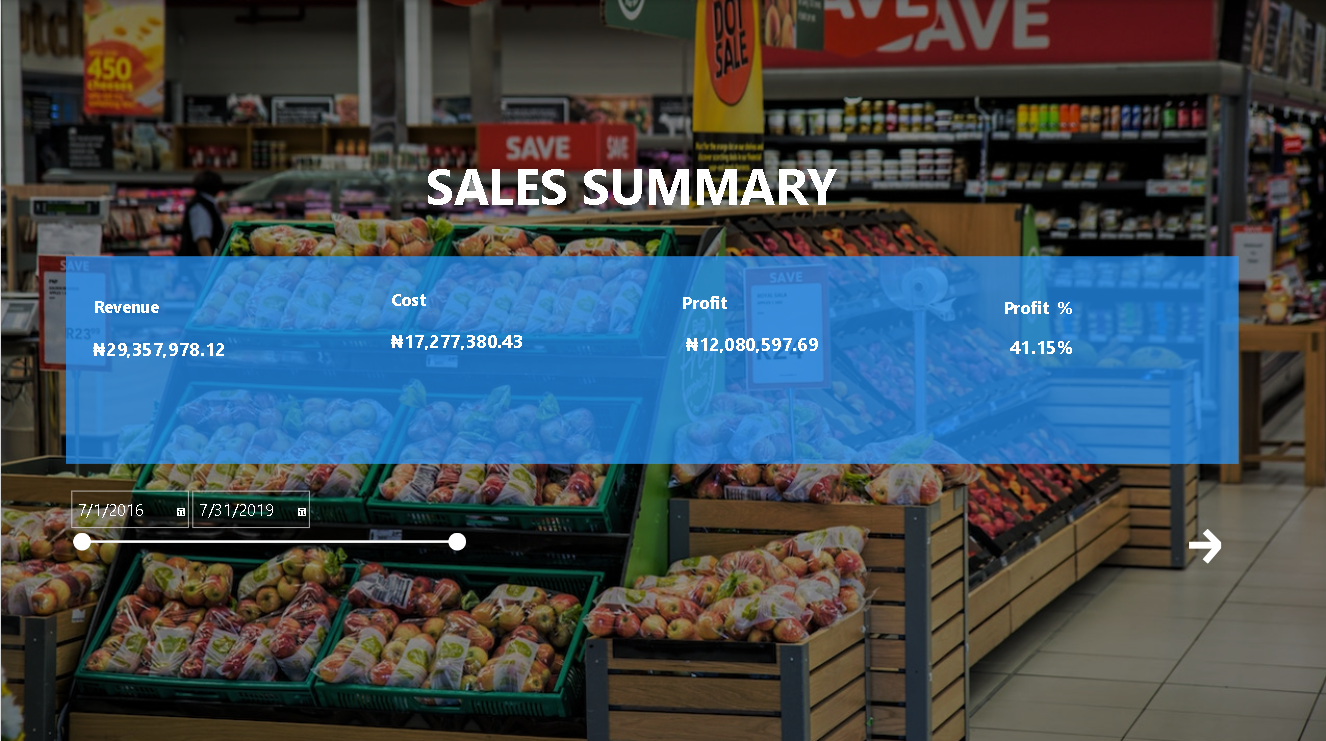
Developed an interactive Power BI executive summary dashboard designed to give management a clear, high-level view of overall store performance. The landing page presents the most important financial KPIs at a glance, allowing decision-makers to quickly assess revenue, costs, profitability, and profit margins.
The dashboard reports ?29.36M in revenue, ?17.28M in total costs, ?12.08M in profit, and a 41.15% profit margin. A dynamic date-range slicer enables users to analyze performance across different periods, while intuitive navigation provides seamless access to detailed report pages for deeper analysis.
Tools & Skills: Power BI, Data Modeling, DAX, KPI Development, Interactive Filters, Dashboard Design, and Data Visualization.
Comment (0)
Other projects by Ismail


Talentdigit Resources Limited is a digital training and consulting firm that equips individuals and organizations with digital skills training.


Leave your thought here