
AOBz Nutrition Global Report
Project related images. Click to view
AOBz Nutrition Global Report: Power BI Sales Overview Dashboard
Tools: Power BI Desktop, DAX, Data Modeling, PowerPoint (background design)
Overview
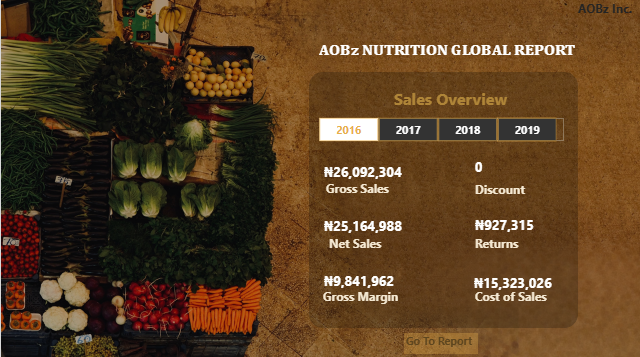
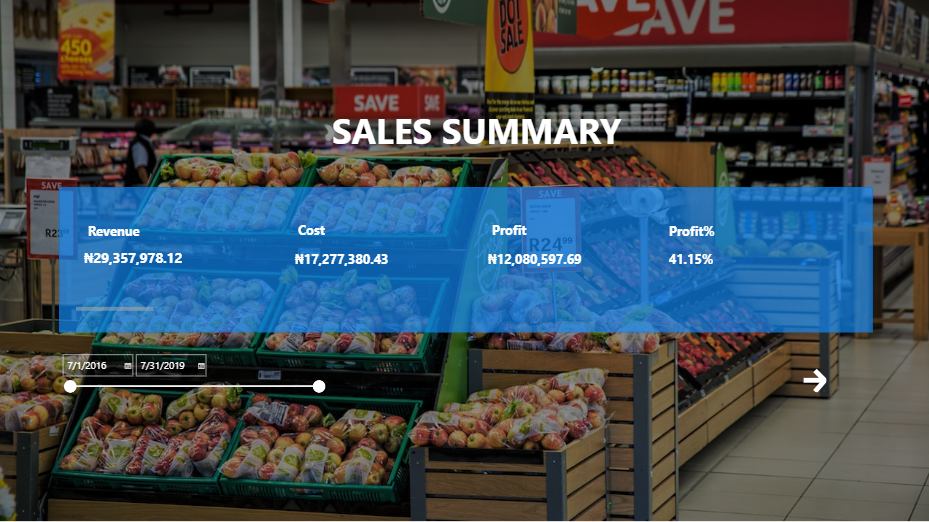
I designed the landing page of a sales analytics dashboard for AOBz Nutrition, a fictional nutrition company. The page gives users a quick view of the company's sales performance and lets them filter every figure by year.
What I built
- Custom background: I edited a market photograph, removing distracting elements and extending the floor texture to a 16:9 canvas. I then darkened it in Power point so the text and figures stand out.
- Sales Overview panel: I styled a semi-transparent card with a gold border and a consistent colour palette, so the page looks polished and readable.
- KPI cards: I built cards for Gross Sales, Net Sales, Gross Margin, Returns, Discount and Cost of Sales, and formatted them in Nigerian naira (?).
- Interactive year slicer: I added tile-style buttons for 2016 to 2019. Selecting a year updates every figure on the page.
- Calculations table : I created a dedicated table for the DAX measures, to keep the model organized.
Key measures (DAX)
- Gross Sales, Cost of Sales, Discount
- Returned Sales, calculated as returned quantity × average selling price
- Net Sales = Gross Sales ? Returned Sales
- Gross Margin = Net Sales ? Cost of Sales
Example result (2016): Gross Sales of ?26.09M, Net Sales of ?25.16M, Cost of Sales of ?15.32M and a Gross Margin of ?9.84M.
Skills demonstrated
DAX measures, data modelling across Sales, Returns and Products tables, KPI design, slicers and interactivity, visual formatting, and dashboard storytelling.
Comment (0)
Other projects by Ogechi

Talentdigit Resources Limited is a digital training and consulting firm that equips individuals and organizations with digital skills training.


Leave your thought here