
Sales Performance Summary
Project related images. Click to view
Sales Performance Summary Dashboard | Power BI
I built this dashboard to turn raw sales data into clear, decision-ready insight. I analysed the sales data and presented the headline results on a single overview page.
What it shows
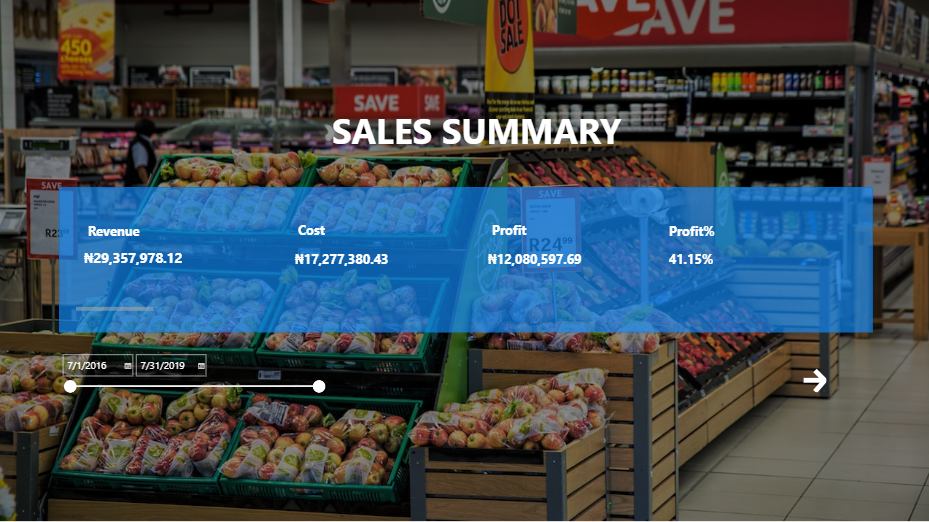
For the period July 2016 to July 2019, the dashboard reports:
- Revenue: ? 29,357,978.12
- Cost: ? 17,277,380.43
- Profit: ? 12,080,597.69
- Profit margin: 41.15%
Features
- KPI cards put the four key figures at the top, so that a manager can read the
business's performance in seconds.
- A date range slicer lets users change the period, and every figure
updates to match.
- A navigation button leads on to further pages of the report.
- A clean, readable layout with a retail-themed background.
What the numbers
tell us
The business kept about ?41 of every ?100 earned as profit, and about ?59 went
to costs. A margin of this size is a useful starting point for asking where
costs could be reduced or which products and periods drive the most profit.
What I did
I cleaned the sales data, analyzed it with PowerBI, calculated total revenue, cost, profit and profit
margin, and designed and built the report page with filters and navigation.
Comment (0)
Other projects by Ogechi

Talentdigit Resources Limited is a digital training and consulting firm that equips individuals and organizations with digital skills training.


Leave your thought here