
Sales Perfomance Analysis
Project related images. Click to view
Sales Performance Dashboard | Power BI
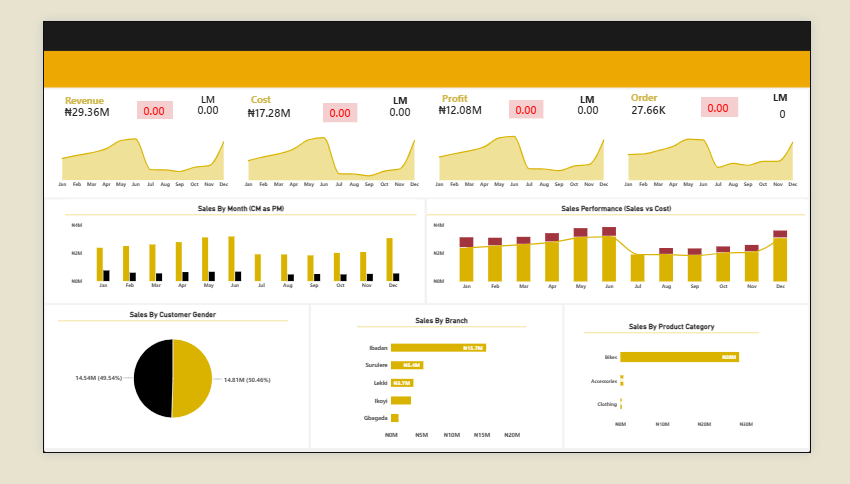
As part of my data analytics training, I was given a retail sales dataset for a bike business with multiple branches and asked to turn it into a dashboard that helps managers understand performance and make decisions.
What I did
- Cleaned and prepared the data, then built a data model linking sales, products, customers and branches.
- Wrote DAX measures for Revenue, Cost, Profit, Orders and last-month (LM) comparisons.
- Designed a single-page dashboard with KPI cards, trend sparklines and visuals for monthly sales, sales vs cost, customer gender, branch performance and product category.
What the dashboard shows
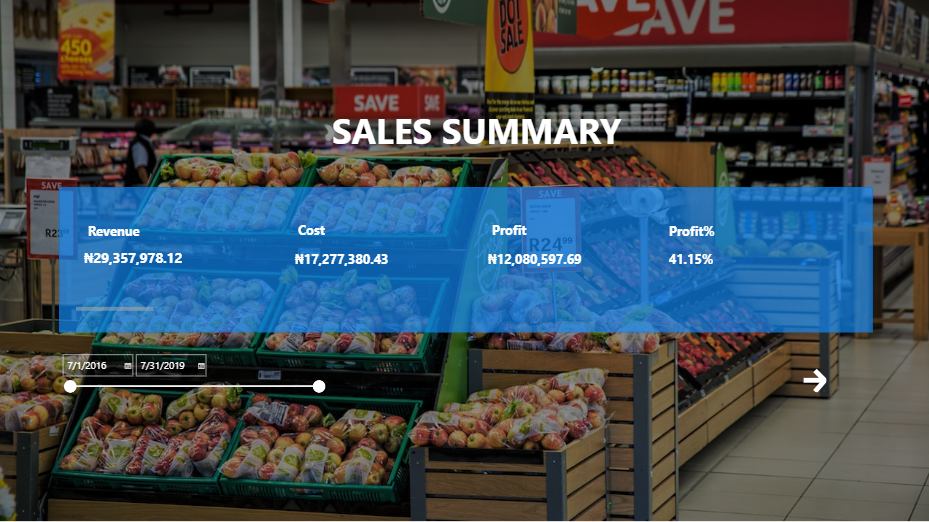
- The business generated ?29.36M in revenue and ?12.08M in profit from 27.66K orders, a margin of roughly 41%.
- Sales peak in May and June, dip in July, then recover strongly toward December.
- Ibadan is the top branch at about ?15.7M, well ahead of the others.
- Bikes drive almost all sales, so Accessories and Clothing are the clearest growth opportunities.
- Customers are split almost evenly by gender (about 49.5% and 50.5%).
Key features
- KPI cards: Total Revenue (?29.36M), Cost (?17.28M), Profit (?12.08M) and Orders (27.66K). Each has a monthly trend sparkline and a last-month (LM) comparison.
- Sales by Month (CM as PM): Compares current-month sales against the previous month to show month-on-month movement.
- Sales Performance (Sales vs Cost): Stacked columns with a trend line show how cost sits against sales each month, highlighting margin across the year.
- Sales by Customer Gender: A near-even split between customers (about 49.5% and 50.5%).
- Sales by Branch: Ibadan leads with about ?15.7M, followed by Surulere, Lekki, Ikoyi and Gbagada.
- Sales by Product Category: Bikes account for the overwhelming majority of sales, with Accessories and Clothing contributing far less. What I learned
This project strengthened my skills in data modelling, DAX, and choosing visuals that tell a clear story.
Tools: Power BI, DAX, Power Query, data modelling, data visualization
Comment (0)
Other projects by Ogechi

Talentdigit Resources Limited is a digital training and consulting firm that equips individuals and organizations with digital skills training.


Leave your thought here