
Healthcare Finance Analysis
Project related images. Click to view
Healthcare Finance Dashboard | Power BI
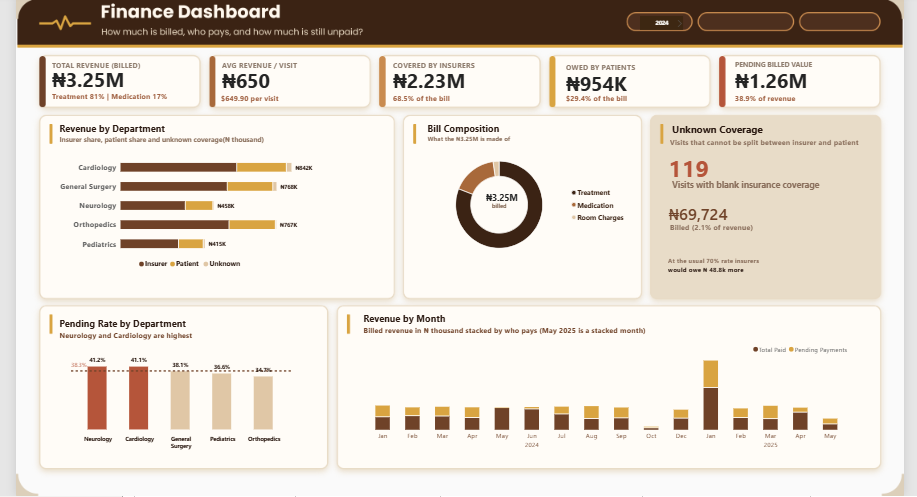
As part of my data analytics training, I was given data for a healthcare provider (Masarati Healthcare) and I answered 3 finance questions three questions: how much is billed, who pays, and how much is still unpaid.
What I did
- Cleaned the billing data and handled visits with missing insurance coverage.
- Built a data model and DAX measures for billed revenue, average revenue per visit, insurer share, patient share, pending value and pending rate.
- Designed a one-page finance dashboard with KPI cards, a revenue breakdown by department, bill composition, a pending-rate comparison, and a monthly paid vs pending trend.
- Added a dedicated “Unknown Coverage” panel to flag billing that can’t be assigned to an insurer or a patient.
What the dashboard shows
- Total billed revenue is ?3.25M, averaging ?650 per visit. Treatment makes up 81% of billing and medication 17%.
- Insurers cover ?2.23M (68.5% of the bill) and patients owe ?954K (29.4%).
- ?1.26M, or 38.9% of revenue, is still pending.
- Neurology (41.2%) and Cardiology (41.1%) have the highest pending rates, above the overall average, which makes them the priority for collections follow-up.
- General Surgery and Orthopedics generate the most revenue, at about ?768K and ?767K.
- 119 visits have blank insurance coverage (?69,724 billed, 2.1% of revenue). At the usual 70% insurer rate, insurers would owe roughly ?48.8K more.
- Billed revenue spikes in January 2025, and pending payments are a visible slice of nearly every month.
What I learned
This project taught me to frame a dashboard around business questions rather than just charts, and to deal with incomplete data openly instead of hiding it.
Tools: Power BI, DAX, Power Query, data modelling, data visualization
Comment (0)
Other projects by Ogechi

Talentdigit Resources Limited is a digital training and consulting firm that equips individuals and organizations with digital skills training.


Leave your thought here