
Sales Performance
Project related images. Click to view
ABC Stores Sales Dashboard | Excel
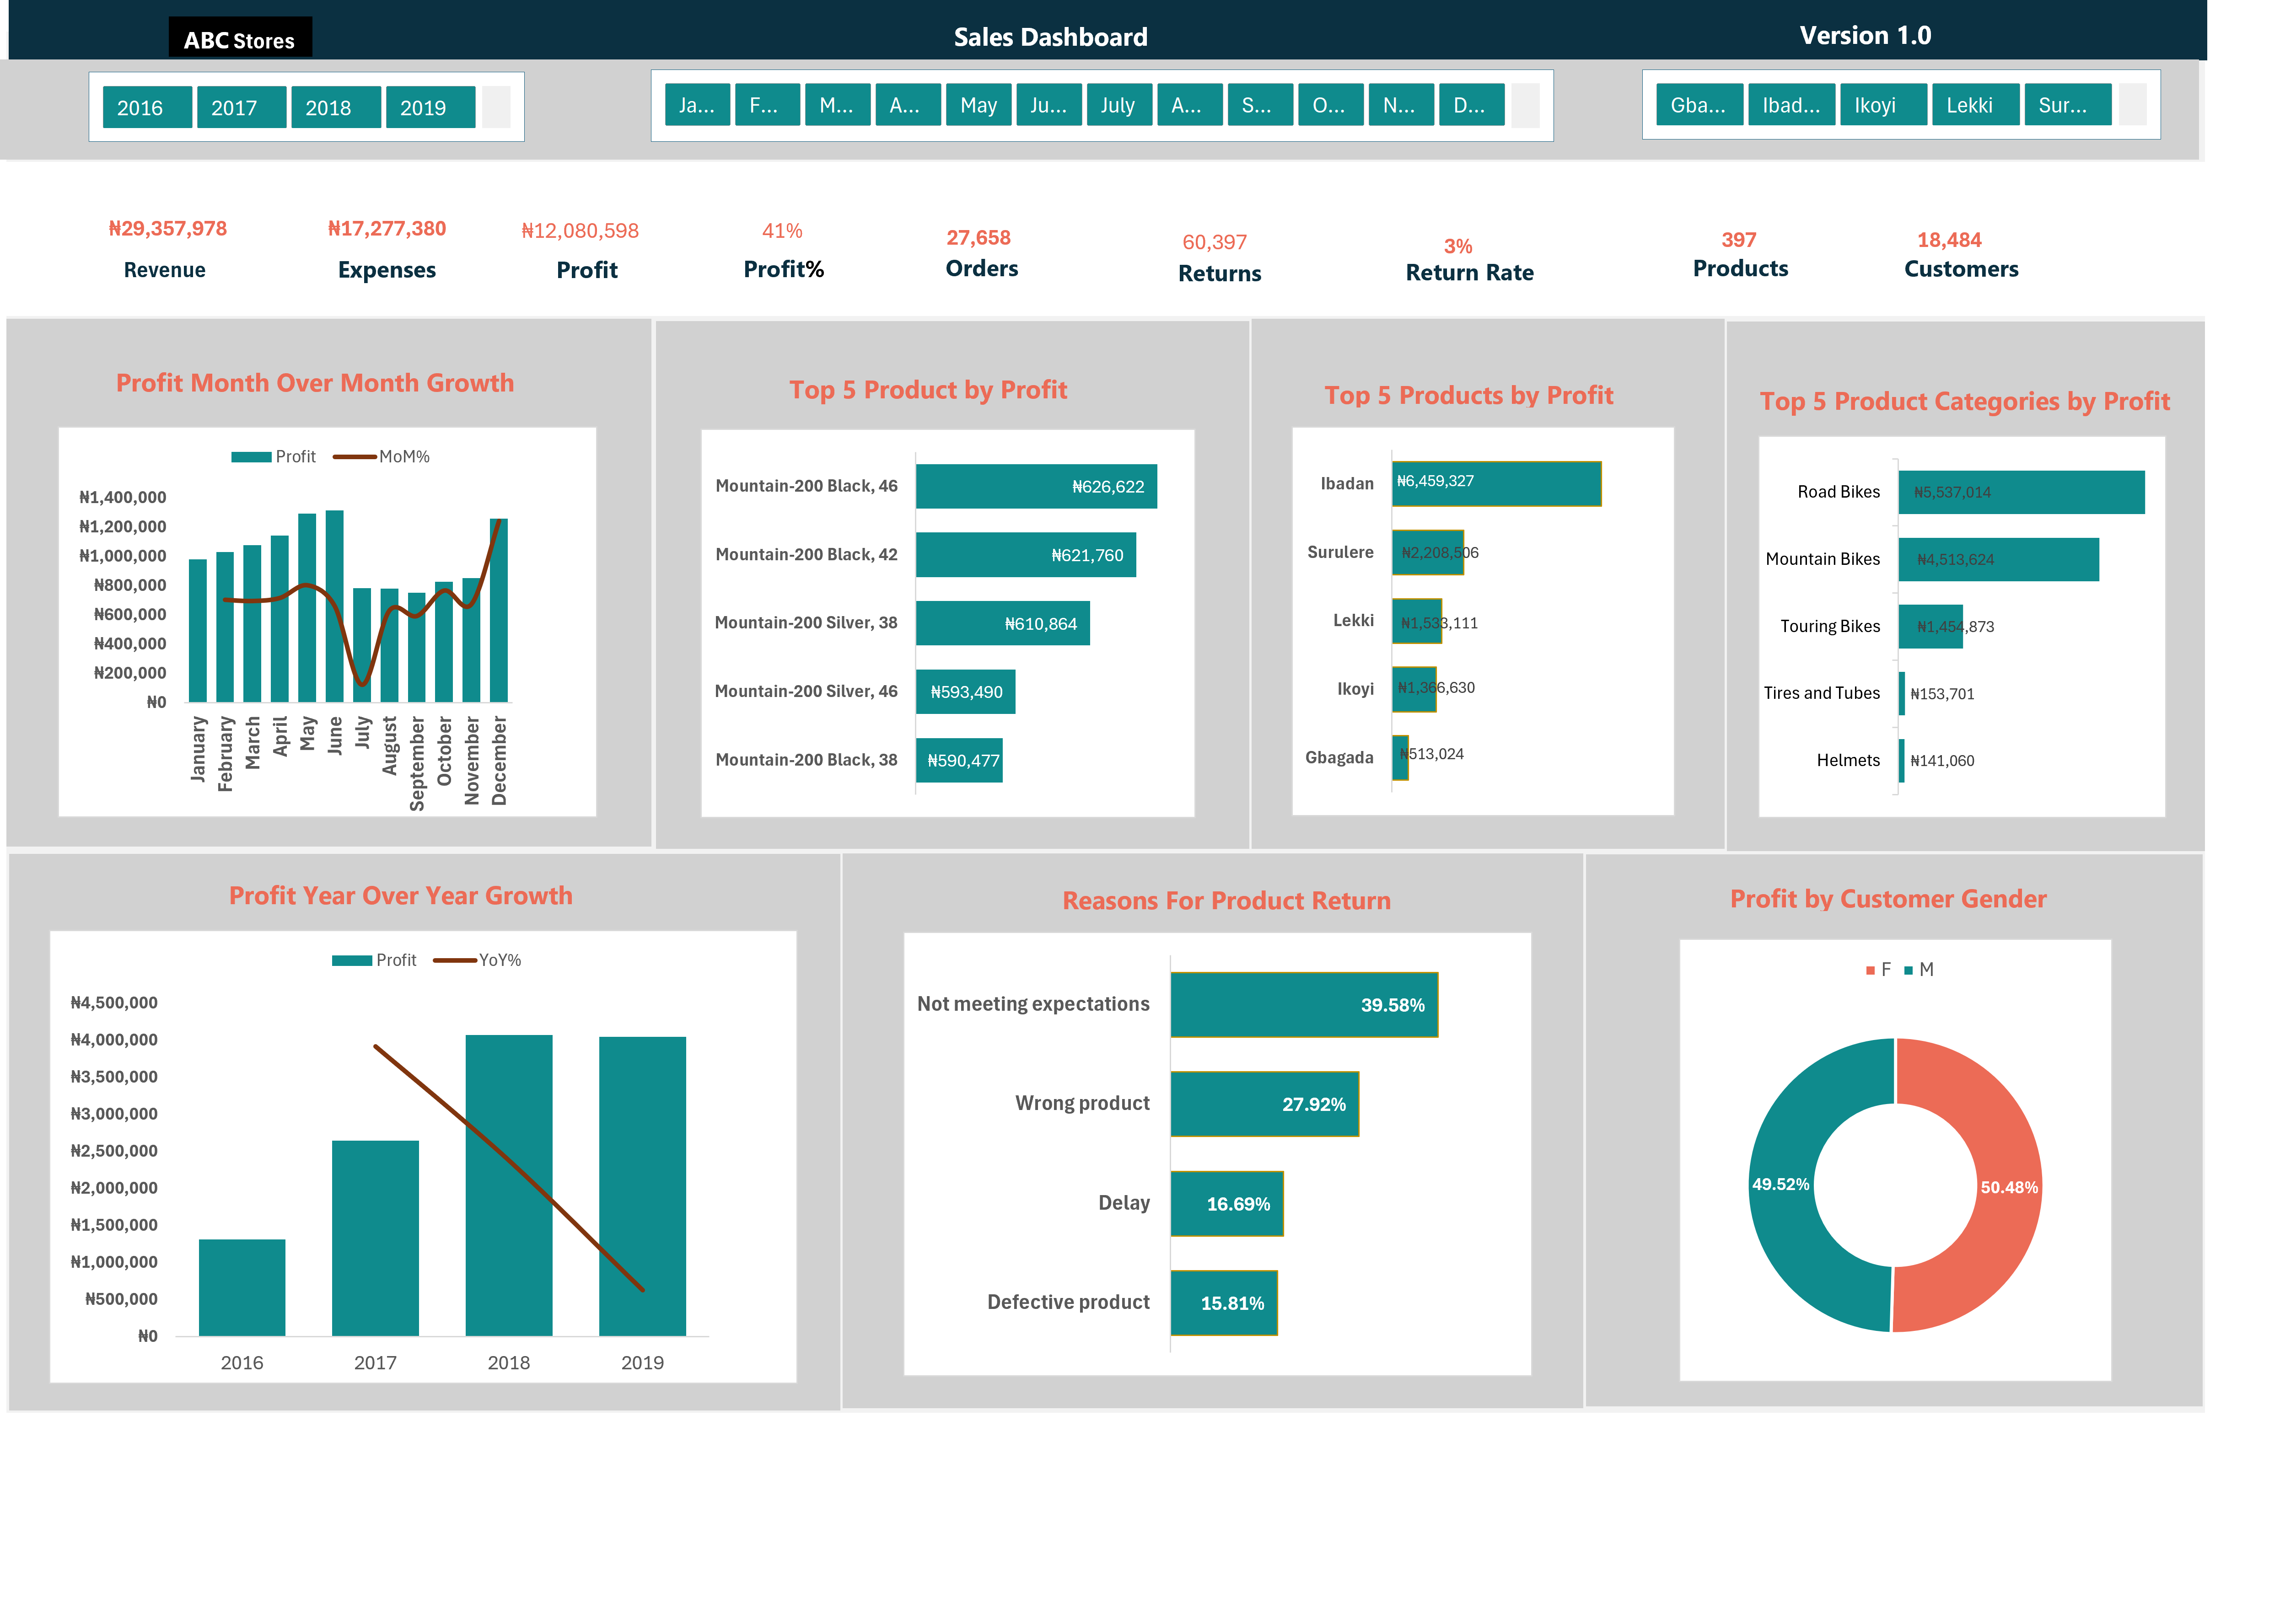
As part of my data analytics training, I was asked to build an interactive sales dashboard in Excel for ABC Stores, a multi-branch bike retailer, covering sales, profit, returns, products and customers from 2016 to 2019.
What I did
- Cleaned and prepared the sales data, then built PivotTables to summarise it.
- Created calculated measures for Profit, Profit %, Return Rate, Month-over-Month (MoM%) growth and Year-over-Year (YoY%) growth.
- Built PivotCharts and arranged them into a single-page dashboard with KPI cards.
- Added slicers for Year, Month and Branch so users can filter every chart at once.
What the dashboard shows
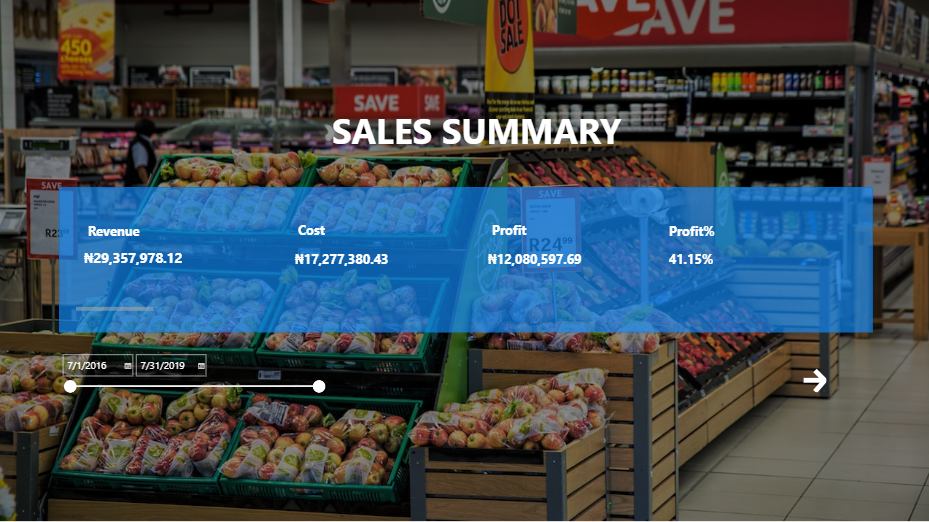
- ABC Stores generated ?29.36M in revenue against ?17.28M in expenses, giving ?12.08M profit and a 41% profit margin.
- The business handled 27,658 orders across 397 products and 18,484 customers, with a 3% return rate.
- Monthly profit peaks around May and June, drops sharply in July, then recovers strongly into December.
- Profit grew strongly from 2016 to 2018, then levelled off in 2019.
- Ibadan is the top branch by profit at about ?6.46M, ahead of Surulere (?2.21M) and Lekki (?1.53M).
- Road Bikes (?5.54M) and Mountain Bikes (?4.51M) are the top categories, and Mountain-200 models dominate the top five products.
- The main reasons for returns are products not meeting expectations (39.58%) and wrong product (27.92%), which points to product descriptions and order accuracy as areas to improve.
- Profit is split almost evenly between male and female customers (about 50.5% and 49.5%).
What I learned
This project strengthened my skills in PivotTables, slicers, calculated measures and dashboard layout.
Tools: Microsoft Excel, PivotTables, PivotChart, Slicers, data cleaning, dashboard design
Comment (0)
Other projects by Ogechi

Talentdigit Resources Limited is a digital training and consulting firm that equips individuals and organizations with digital skills training.


Leave your thought here