
DATABASE FOR NGOs, ASSOCIATION AND COOPERATIVE SOCITIES
Project related images. Click to view
Comprehensive Summary of the Dashboard
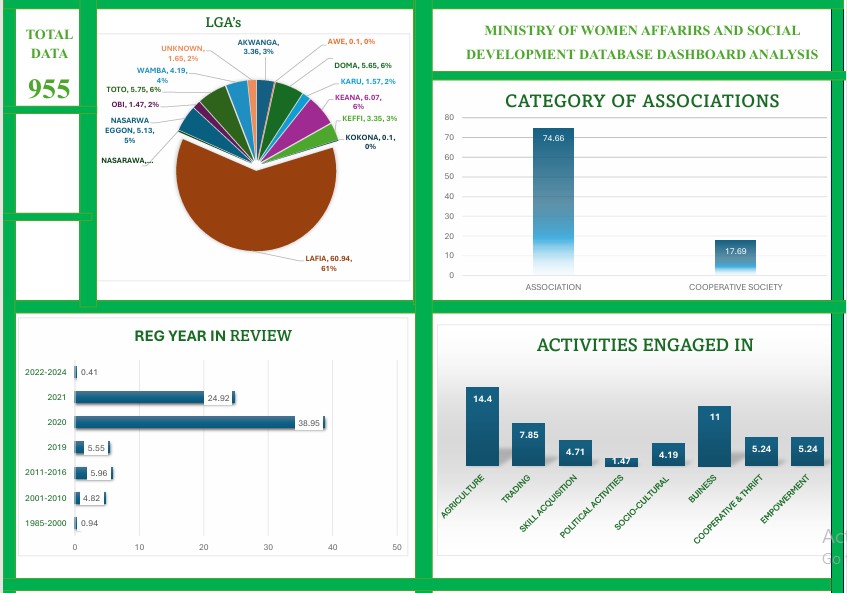
The Ministry of Women Affairs and Social Development Database Dashboard presents an analytical overview of 955 recorded data entries, highlighting key trends in Local Government Area (LGA) distribution, association types, registration timelines, and activities.
1. Local Government Area (LGA) Distribution
A pie chart illustrates data distribution across various LGAs. The highest representation comes from Lafia (60.94%), followed by:
- Keana (6.07%)
- Doma (5.65%)
- Nasarawa Eggon (5.13%)
- Toto (5.76%)
- Other LGAs, such as Obi, Wamba, Awe, Karu, and Kokona, have significantly smaller shares.
2. Category of Associations
The majority of registered groups are Associations (74.66%), while Cooperative Societies make up 17.69%. This suggests a stronger preference for associations over cooperatives in the data set.
3. Registration Year Trends
A bar chart tracks registration activity over different periods:
- 2020 had the highest registrations (38.95%), likely due to increased awareness or policy changes.
- 2021 followed with 24.92%, showing sustained engagement.
- Older registrations (before 2010) were minimal, with less than 5% recorded before 2001.
4. Activities Engaged In
A bar chart outlines various activities pursued by registered groups. The most common activities include:
- Agriculture (14.4%) – The most dominant sector, indicating a strong focus on farming-related ventures.
- Business (11%) – Reflecting entrepreneurial engagement.
- Trading (7.85%) – Signifying active involvement in commercial activities.
- Empowerment & Cooperative Thrift (5.24% each) – Highlighting self-development and group savings initiatives.
- Political Activities (1.47%) – The least engaged activity.
Conclusion
This dashboard provides a clear and structured view of women’s group participation, economic activities, and registration patterns. The dominance of Lafia, agriculture, and associations suggests key areas for further development and support. The insights can be valuable for policy planning, program development, and resource allocation to strengthen women's economic and social inclusion.
TOOLS USED: EXCEL, POWER QUARY, POWER BI, AND SGL
Comment (0)
Other projects by Kayode
Talentdigit Resources Limited is a digital training and consulting firm that equips individuals and organizations with digital skills training.
Address: 4 Amurie omanze street (off star time junction) Garki 2, Abuja
For Inquiries Call: +234 (0) 7062274671


Leave your thought here