
WAEC Performance Dashboard for Greater Level Comprehensive School (2020–2024)
Project related images. Click to view
Project Title: WAEC Performance Dashboard for Greater Level Comprehensive School (2020–2024)
Objective:
To analyze and visualize the academic performance and enrollment trends of students writing WAEC over a five-year period, providing key insights for educators, school administrators, and stakeholders.
Tools Used: Microsoft Excel (Pivot Charts, Slicers, Smart Formatting)
Overview:
This dashboard is designed to provide a clear and interactive representation of student enrollment, category-wise performance, gender comparisons, and top performers in WAEC from 2020 to 2024. Dynamic slicers allow filtering by Gender, Category (Arts, Commercial, Science), and Year for targeted analysis.
Key Insights & Features:
1. Enrollment Overview:
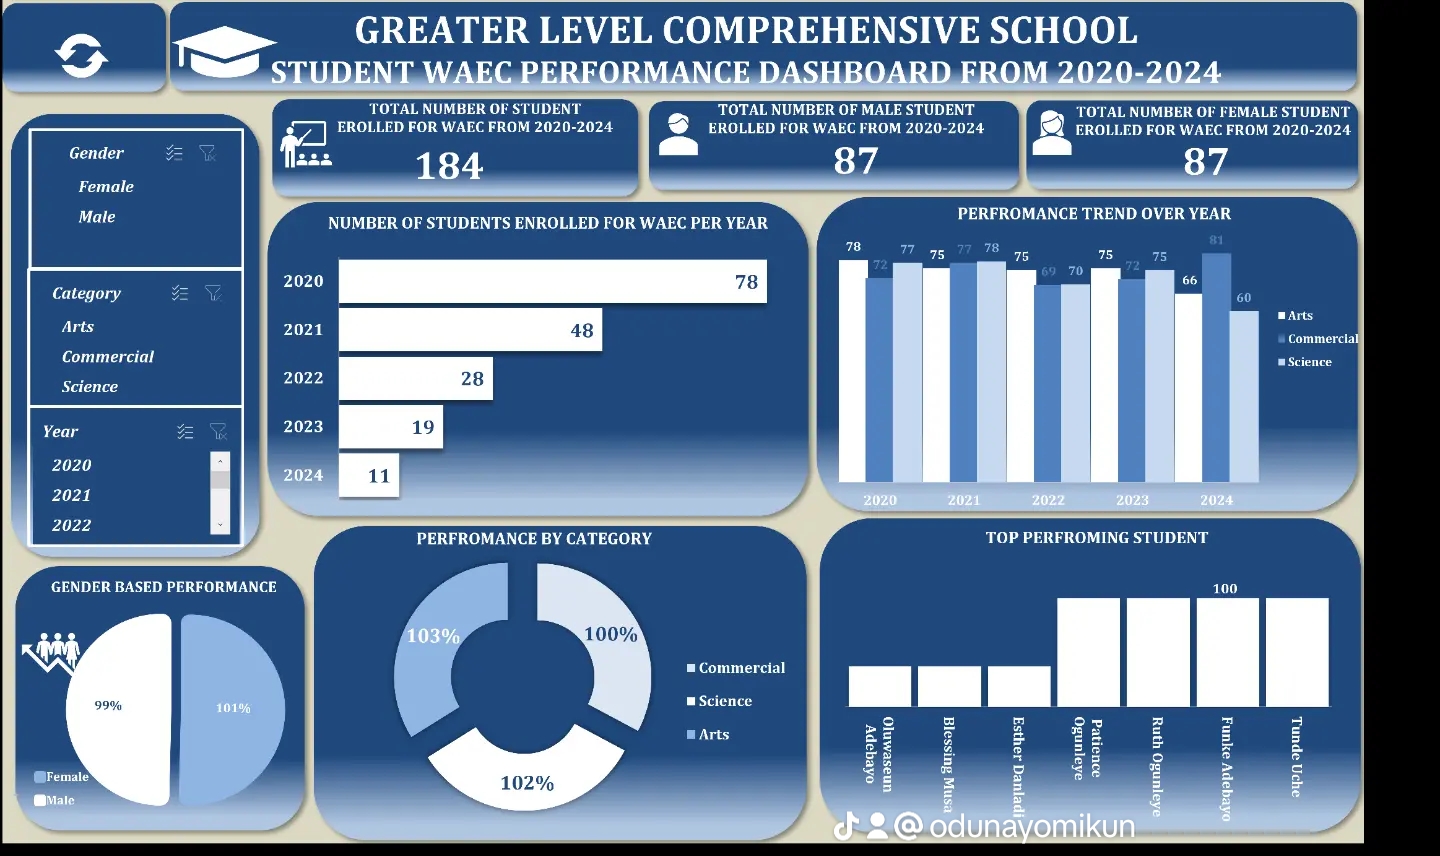
Total Enrolled Students: 184
Male and Female Students: Equal distribution of 87 each
Enrollment peaked in 2020 with 78 students, then gradually declined to 11 students in 2024, signaling a need to evaluate contributing factors.
2. Performance Trends:
The bar chart reflects subject category performance across the years, with Arts and Science students consistently performing well, although a notable drop is seen in Commercial students’ scores in 2024 (60).
3. Category-Wise Analysis:
Performance by category shows near parity:
Commercial: 103%
Science: 102%
Arts: 100%
This indicates balanced academic outcomes across different streams.
4. Gender-Based Performance:
Male students (101%) slightly outperformed female students (99%), showing a fairly balanced academic performance by gender.
5. Top Performing Students:
The dashboard highlights exceptional students like Funke Adebayo, Ruth Ogunleye, and Trudie Uche, all scoring 100, serving as role models for academic excellence.
Impact & Value:
This dashboard serves as a powerful tool for monitoring student performance trends, evaluating gender and category dynamics, and celebrating high achievers. It supports data-driven decisions on curriculum development, academic support, and enrollment strategy.
Reflection:
Through this project, I deepened my skills in educational data analysis, learned to present insights in a visually compelling way, and gained experience in tailoring dashboards for non-technical users such as school administrators and teachers.
Comment (0)
Other projects by Kayode
Talentdigit Resources Limited is a digital training and consulting firm that equips individuals and organizations with digital skills training.
Address: 4 Amurie omanze street (off star time junction) Garki 2, Abuja
For Inquiries Call: +234 (0) 7062274671


Leave your thought here