
INCOME AND EXPENSES TRACKER
Project related images. Click to view
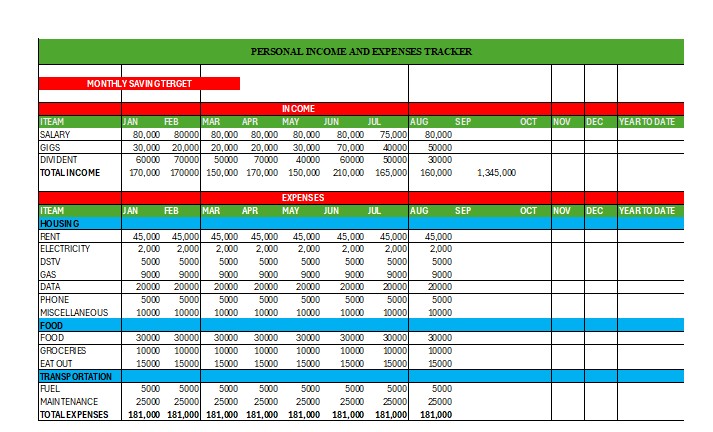
PERSONAL INCOME AND EXPENSES TRACKER
A red-highlighted section labeled "MONTHLY SAVINGS TARGET" is included witAh a target of 1,000.
Income Section (Red Header)
Contains columns for each month from January to December, with an additional Year-to-Date (YTD) column.
Lists different sources of income:
- Salary
- Gigs
- Dividend
- Monthly income values are recorded, and the Total Income is calculated for each month.
- The Year-to-Date (YTD) Total Income is shown as 1,345,000.
-
Expenses Section (Blue and Red Headers)
- Similar to the income section, this tracks various expenses month-by-month.
- Categories of Expenses:
- Housing:
- Rent
- Electricity
- DSTV
- Gas
- Data
- Phone
- Miscellaneous
- Food:
- Food
- Groceries
- Eat out
- Transportation:
- Fuel
- Maintenance
- Housing:
- Each item has a fixed or varying monthly cost.
- Total Expenses for each month are 181,000.
-
General Observations:
- The expenses remain constant across months.
- There is a notable difference between income and expenses, indicating possible savings or additional expenditures.
- Certain months (like July) show increased income, likely due to higher gig or dividend earnings.
This tracker is a well-organized financial tool for budgeting and monitoring cash flow throughout the year. Let me know if you need any modifications or insights!
In Summary:
- Income Section: Tracks earnings from salary, gigs, and dividends. The total income varies monthly, with a Year-to-Date (YTD) total of 1,345,000. Expenses Section: Categorized into Housing, Food, and Transportation, with fixed monthly expenses totaling 181,000 per month.
- Savings: A Monthly Savings Target of 1,000 is indicated.
- Key Insight: Income fluctuates, while expenses remain constant, making it easier to track savings and financial planning over the year. TOOLS USED: MICROSOFT EXCEL,
Comment (0)
Other projects by Kayode
Talentdigit Resources Limited is a digital training and consulting firm that equips individuals and organizations with digital skills training.
Address: 4 Amurie omanze street (off star time junction) Garki 2, Abuja
For Inquiries Call: +234 (0) 7062274671


Leave your thought here