
2022 Methane Emission
Project related images. Click to view
2022 Methane Emission Dashboard (Excel)
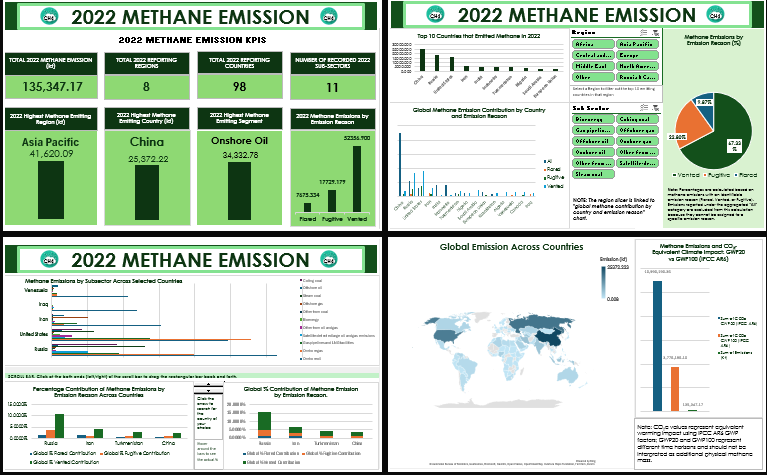
A four-page interactive Excel dashboard analysing global methane emissions in 2022. It shows which regions, countries, sub-sectors and emission types contribute most, and converts those emissions into climate impact.
Page 1: KPI overview
- Total 2022 methane emissions: 135,347.17 kt, reported across 98 countries, 8 regions and 11 sub-sectors.
- Highest emitting region: Asia Pacific (41,620.09 kt).
- Highest emitting country: China (25,372.22 kt).
- Highest emitting segment: Onshore Oil (34,332.78 kt).
- Emissions by reason: Vented is the largest, followed by Fugitive and then Flared.
Page 2: Countries and emission reasons
- A ranked chart of the top 10 methane-emitting countries, led by China.
- A clustered chart splitting each country’s emissions into Flared, Fugitive and Vented.
- A pie chart of emission reasons, with Vented accounting for roughly two-thirds.
- Region and Sub-Sector slicers that filter the page.
Page 3: Sub-sector and country comparison
- Methane emissions by sub-sector across selected countries (Russia, the United States, Iran, Iraq, Venezuela).
- The percentage contribution of each emission reason within Russia, Iran, Turkmenistan and China, with a scroll bar to move through the countries.
Page 4: Global and climate impact view
- A world map shaded by emission level.
- A comparison of methane’s CO?-equivalent impact over 20 years (GWP20) and 100 years (GWP100), using IPCC AR6 factors.
Key takeaways
- Emissions are concentrated in Asia Pacific, China and Onshore Oil.
- Venting is the dominant emission pathway, so reducing it is the biggest lever.
- Over a 20-year horizon, methane’s warming impact is far larger than its 100-year figure suggests.
Tools and skills demonstrated
- Excel (pivot tables and pivot charts, slicers, scroll bars, map chart, dashboard layout)
- Multi-view analysis by region, country, sub-sector and emission type
- Climate data communication (GWP20 versus GWP100)
Comment (0)
Other projects by Wilfred

Talentdigit Resources Limited is a digital training and consulting firm that equips individuals and organizations with digital skills training.


Leave your thought here