
ABC Sales Analysis
Project related images. Click to view
ABC Sales Dashboard (Excel)
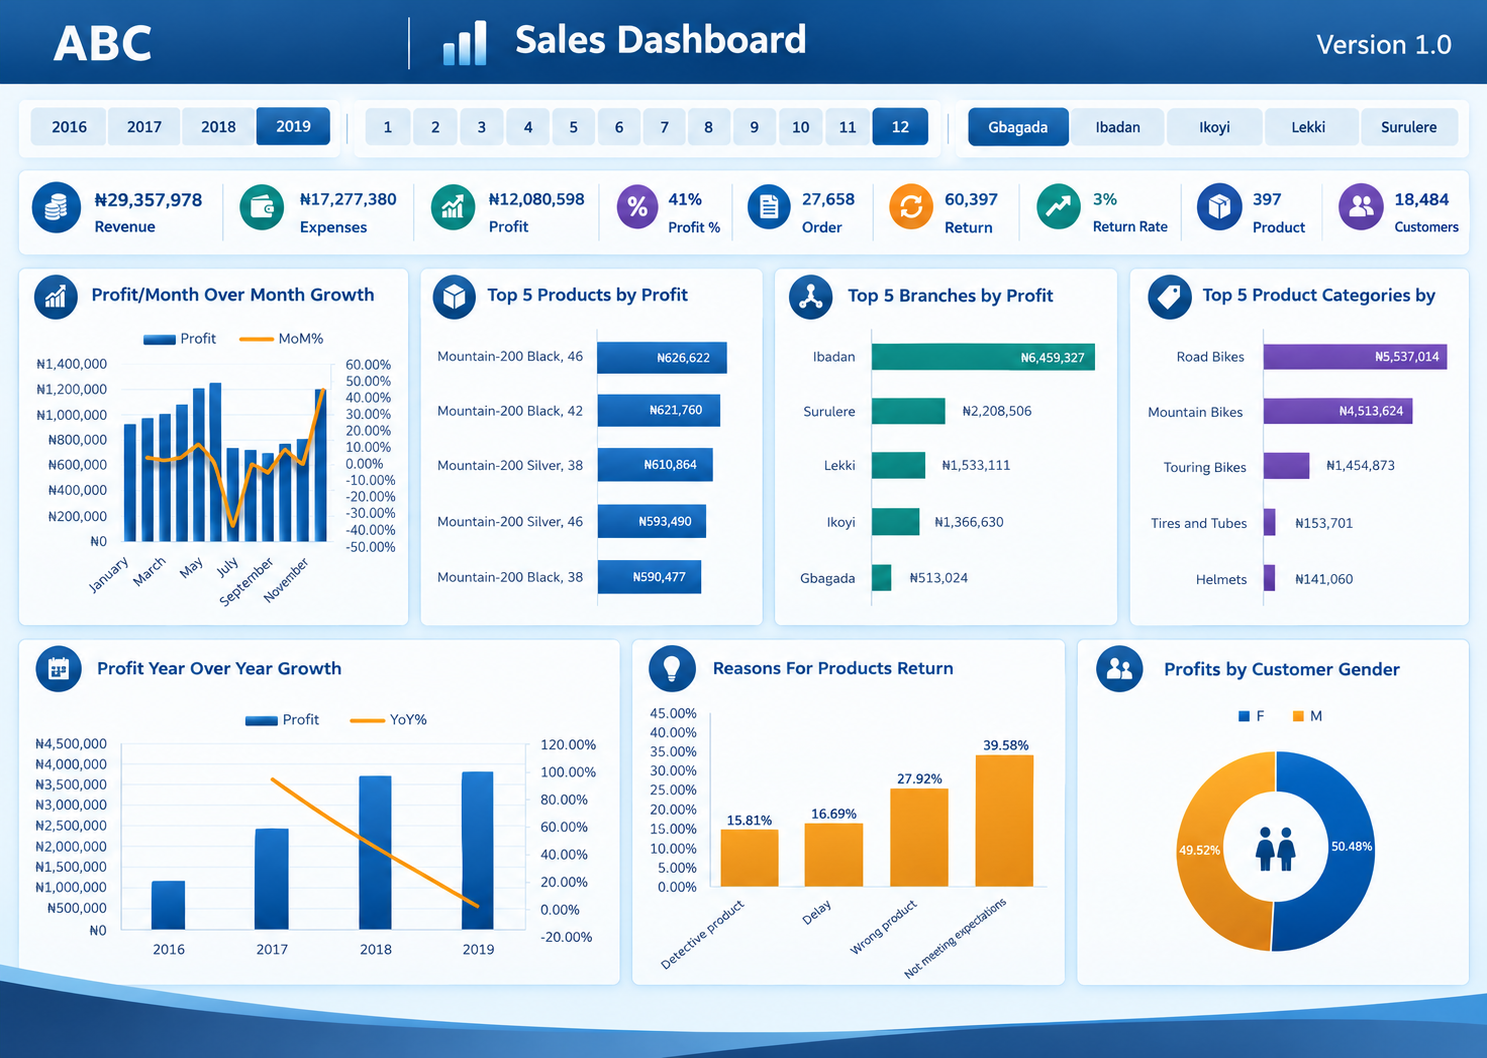
An interactive sales performance dashboard built for a bicycle and accessories retailer ("ABC"), covering 2016–2019 across five branches (Gbagada, Ibadan, Ikoyi, Lekki, Surulere). The dashboard consolidates revenue, cost, profitability, order and customer data into a single, slicer-driven view for management reporting.
Key features
- Interactive filtering: Year, month, and branch slicers let users drill into performance for any period or location without touching the underlying data.
- KPI summary bar: Nine headline metrics at a glance — Revenue, Expenses, Profit, Profit %, Orders, Returns, Return Rate, Product count, and Customer count.
- Trend analysis: Month-over-month and year-over-year profit growth charts (combo column-and-line charts) to track momentum and seasonality.
- Product and branch performance: Ranked bar charts showing the top 5 products, branches, and product categories by profit, highlighting where the business makes the most money.
- Returns analysis: A breakdown of return reasons (defective product, delay, wrong product, unmet expectations) to flag quality and fulfilment issues.
- Customer insight: A profit-by-gender donut chart giving a quick read on the customer base.
Tools and skills demonstrated
- Excel (Power Query/pivot-based data modelling, DAX-style measures or formulas for KPIs, dynamic charts, slicers, and dashboard layout/design)
- Data visualization and storytelling — translating raw sales, return, and customer data into a decision-ready, single-page report
- Dashboard UX — consistent colour system, iconography, and layout so stakeholders can scan KPIs and trends quickly
Purpose
Built to practice end-to-end dashboard design: from structuring raw transactional data, to calculating KPIs, to presenting insights visually for a non-technical audience — a workflow directly transferable to reporting on energy-sector data (e.g., production, pricing, or flaring metrics).
Comment (0)
Other projects by Wilfred
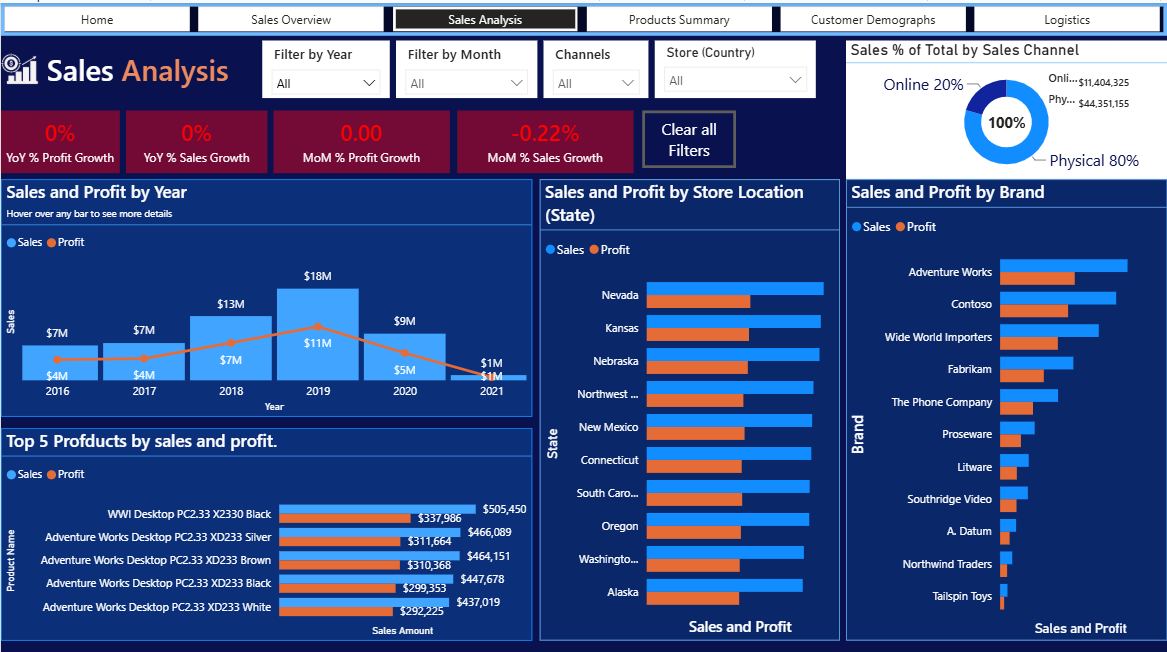
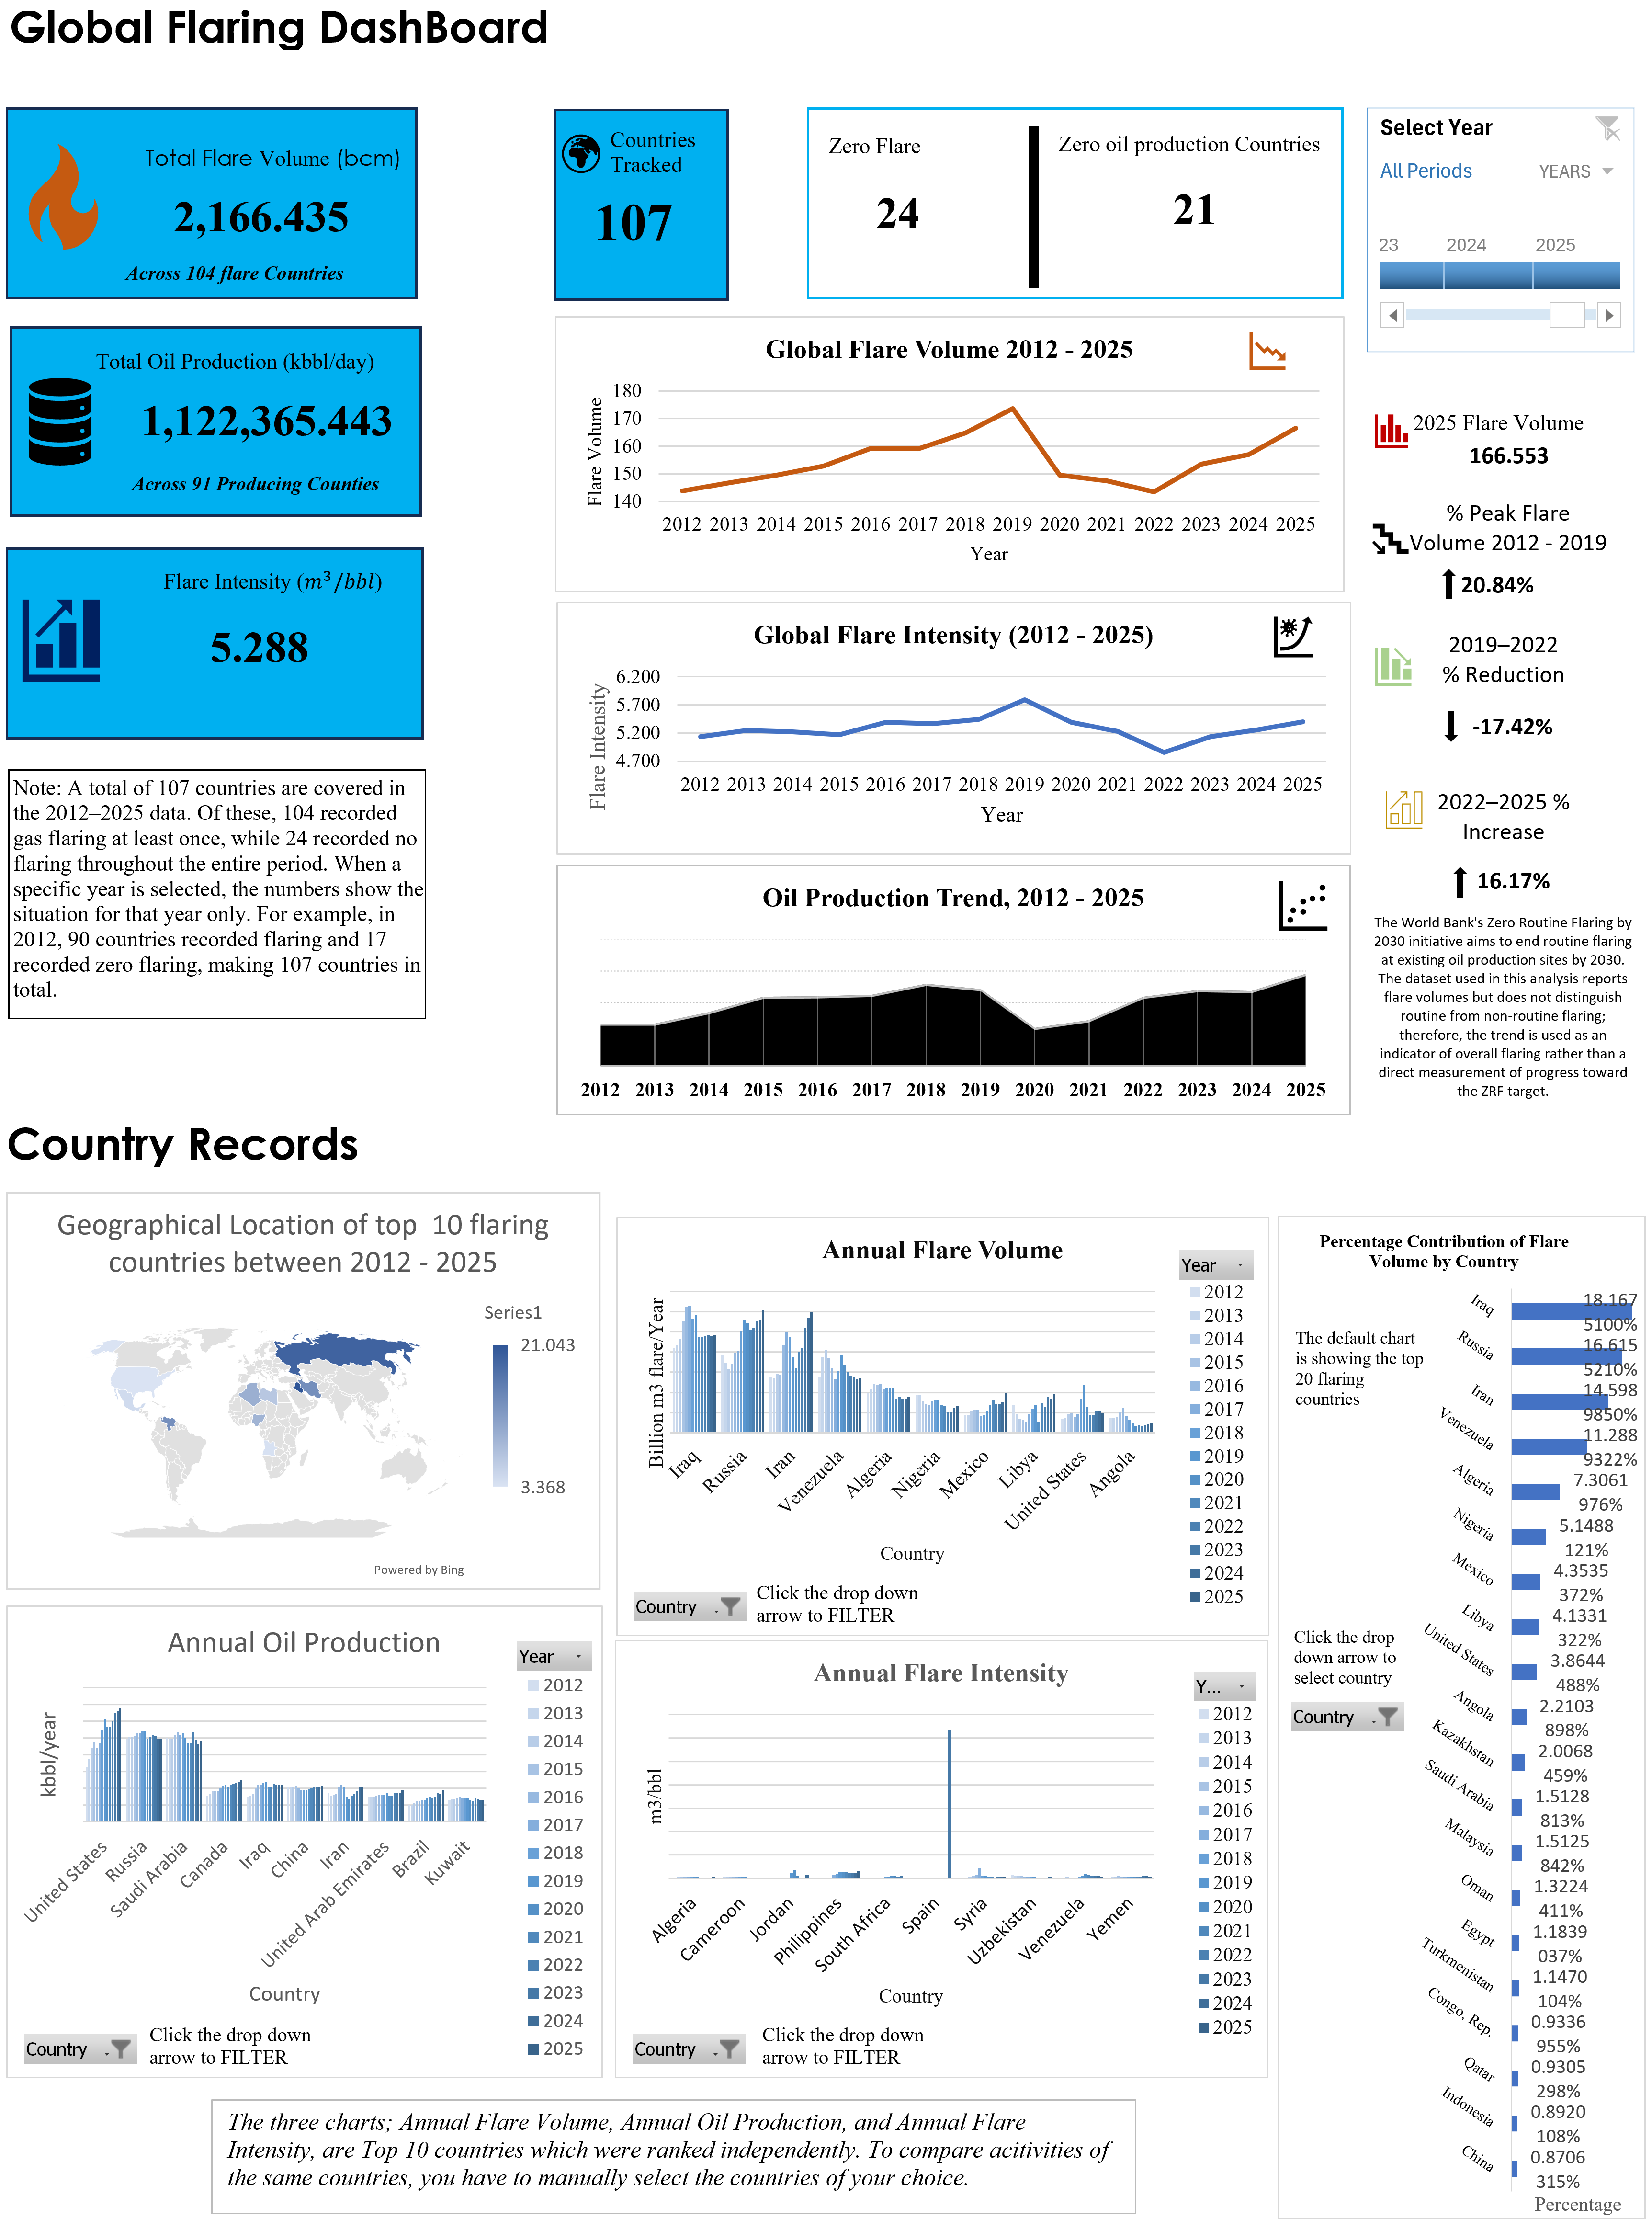
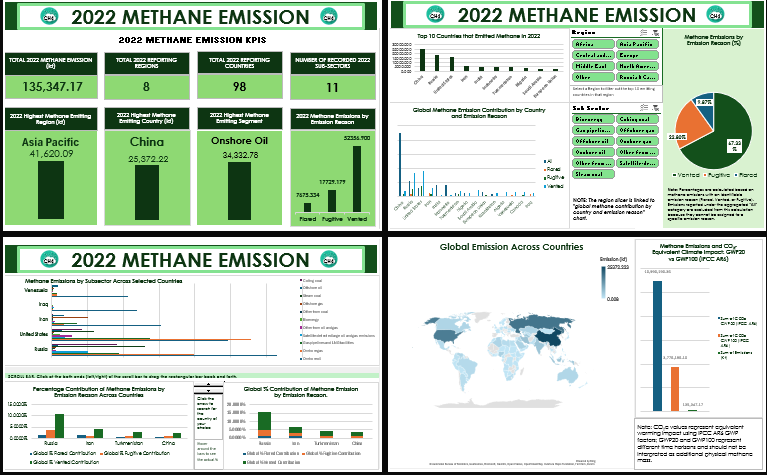


Talentdigit Resources Limited is a digital training and consulting firm that equips individuals and organizations with digital skills training.


Leave your thought here