
Bike Purchase Analysis
Project related images. Click to view
Bike Purchase Analysis Dashboard (Excel)
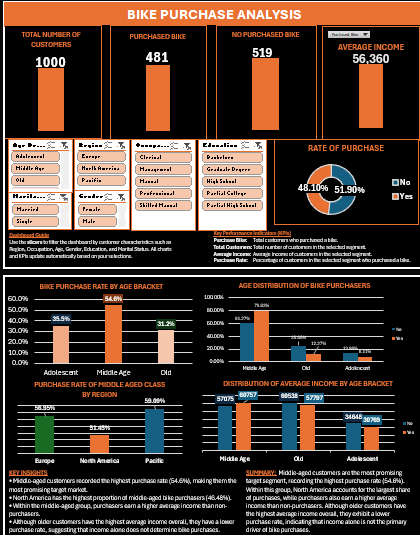
A two-page interactive dashboard analyzing customer bike-purchase behaviour across a 1,000-customer dataset, built to identify who buys bikes and why, using demographic and regional segmentation.
Page 1 — Overview
- Summary KPIs: Total customers (1,000), customers who purchased (481), customers who didn't (519), and average income (?56,360), each displayed with a bar-style visual indicator.
- Slicer panel: Filters for Age Bracket, Region, Occupation, Education, Marital Status, and Gender, allowing every chart and KPI to update dynamically by segment.
- Rate of Purchase donut: Shows an overall purchase split of 51.9% Yes vs 48.1% No.
Page 2 — Deep-Dive Analysis
- Bike Purchase Rate by Age Bracket: A bar chart showing Middle Age customers convert at the highest rate (54.6%), compared to Adolescent (35.5%) and Old (31.2%).
- Age Distribution of Purchasers: A comparison of purchaser vs non-purchaser share within each age group.
- Purchase Rate of Middle-Aged Class by Region: Breaks down the top-converting age group by Europe, North America, and Pacific, with North America and Pacific leading (56.95% and 59.09%).
- Distribution of Average Income by Age Bracket: Compares average income between purchasers and non-purchasers across age groups, showing income alone doesn't predict purchase behaviour.
- Key Insights and Summary panels: Written takeaways translating the charts into plain-language business conclusions (e.g., middle-aged customers are the most promising segment; older customers earn more but buy less).
Tools and skills demonstrated
- Excel (pivot tables/charts, slicers, cross-filtering, KPI calculation, dashboard layout and design)
- Data segmentation and comparative analysis (age, region, income, purchase behaviour)
- Insight synthesis — turning chart-level findings into a written summary and actionable insights for a business audience
- Dashboard UX — consistent dark theme, colour-coded Yes/No categories, and a logical flow from summary KPIs to segment-level detail to written conclusions
Purpose
Built to demonstrate the full analytics workflow: exploring a customer dataset, identifying the segments most likely to convert, and communicating those findings clearly to support marketing or sales targeting decisions.
Comment (0)
Other projects by Wilfred


Talentdigit Resources Limited is a digital training and consulting firm that equips individuals and organizations with digital skills training.


Leave your thought here