
Sales Summary Dashboard
Project related images. Click to view
Sales Summary Dashboard (Power BI)
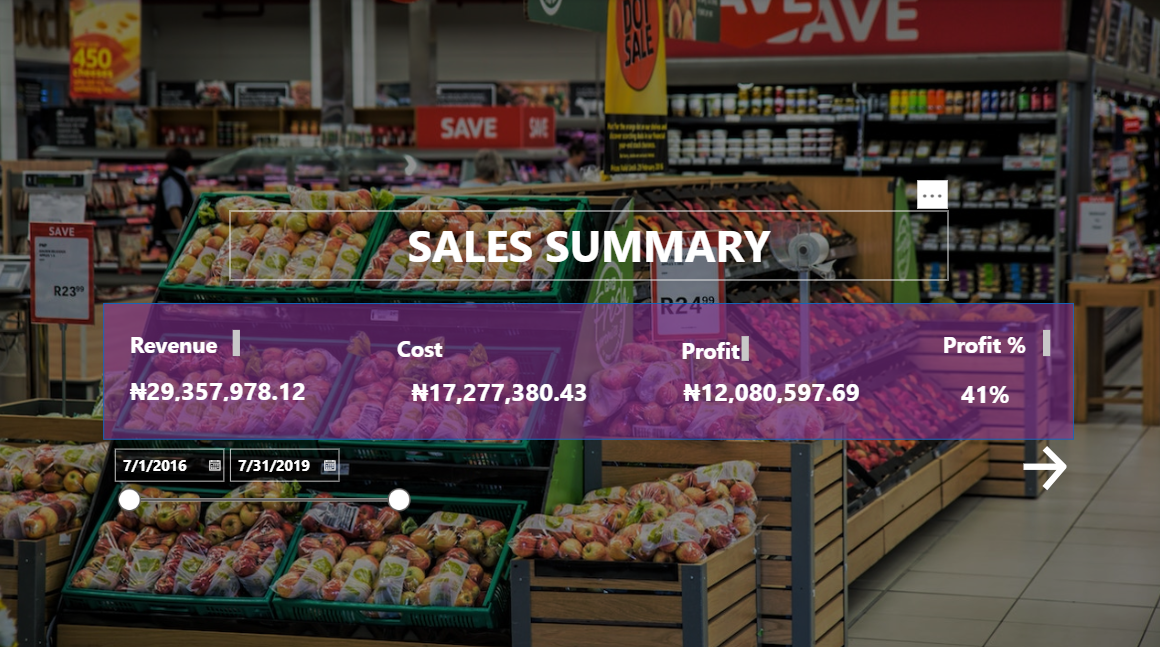
A landing/summary page for a sales performance report, covering transactions from July 2016 to July 2019. Built with a full-bleed retail store background image and a semi-transparent overlay panel to keep the headline KPIs readable without losing visual context.
Key features
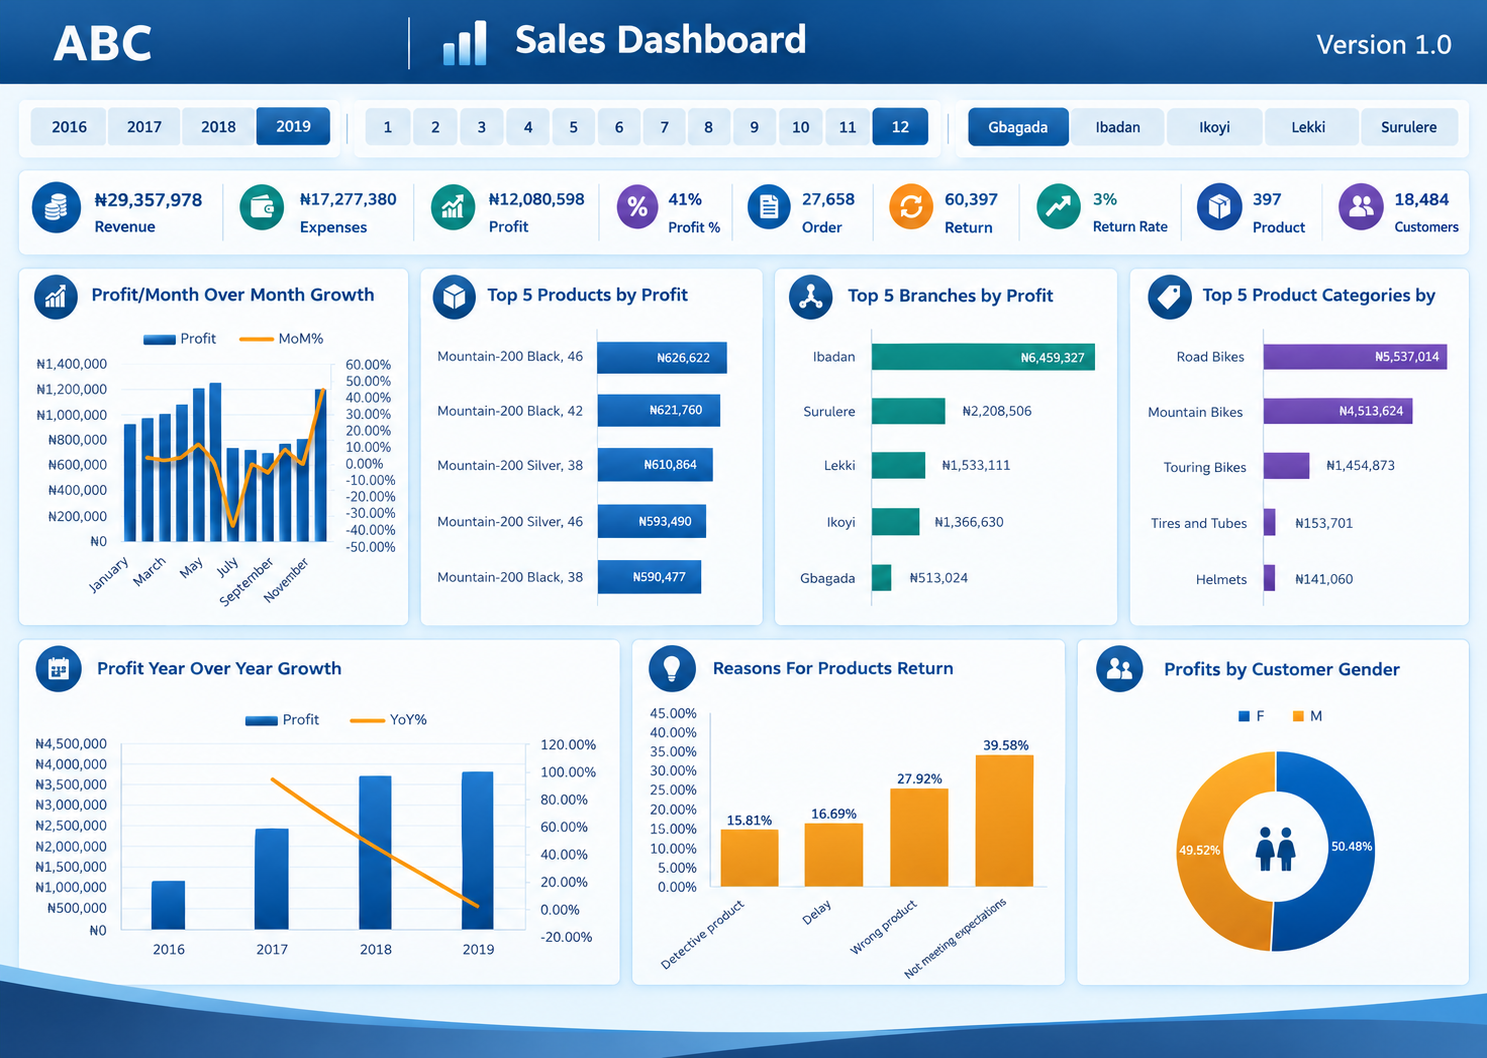
- Headline KPI cards: Revenue (?29,357,978.12), Cost (?17,277,380.43), Profit (?12,080,597.69), and Profit % (41%) — giving an at-a-glance view of overall business performance.
- Date range slicer: An interactive 2016–2019 timeline slider lets users narrow the report to any custom period.
- Navigation: A forward arrow for moving into the detailed report pages (product, branch, and customer-level breakdowns).
Tools and skills demonstrated
- Power BI (DAX measures for Revenue, Cost, Profit, Profit %; date-range slicers; custom report navigation)
- Visual design — using a background image with a transparent overlay panel to create a branded, magazine-style summary page rather than a default chart-heavy layout
- Report structuring — designing a clean "cover" page that leads into deeper analysis, a common pattern in multi-page BI reports
Purpose
Built as the entry point of a multi-page sales report, giving stakeholders an immediate read on overall revenue and profitability before they drill into branch, product, or time-based detail on subsequent pages.
Comment (0)
Other projects by Wilfred


Talentdigit Resources Limited is a digital training and consulting firm that equips individuals and organizations with digital skills training.


Leave your thought here