
Global Flaring Dashboard, 2012–2025
Project related images. Click to view
Global Flaring Dashboard, 2012–2025 (Excel)
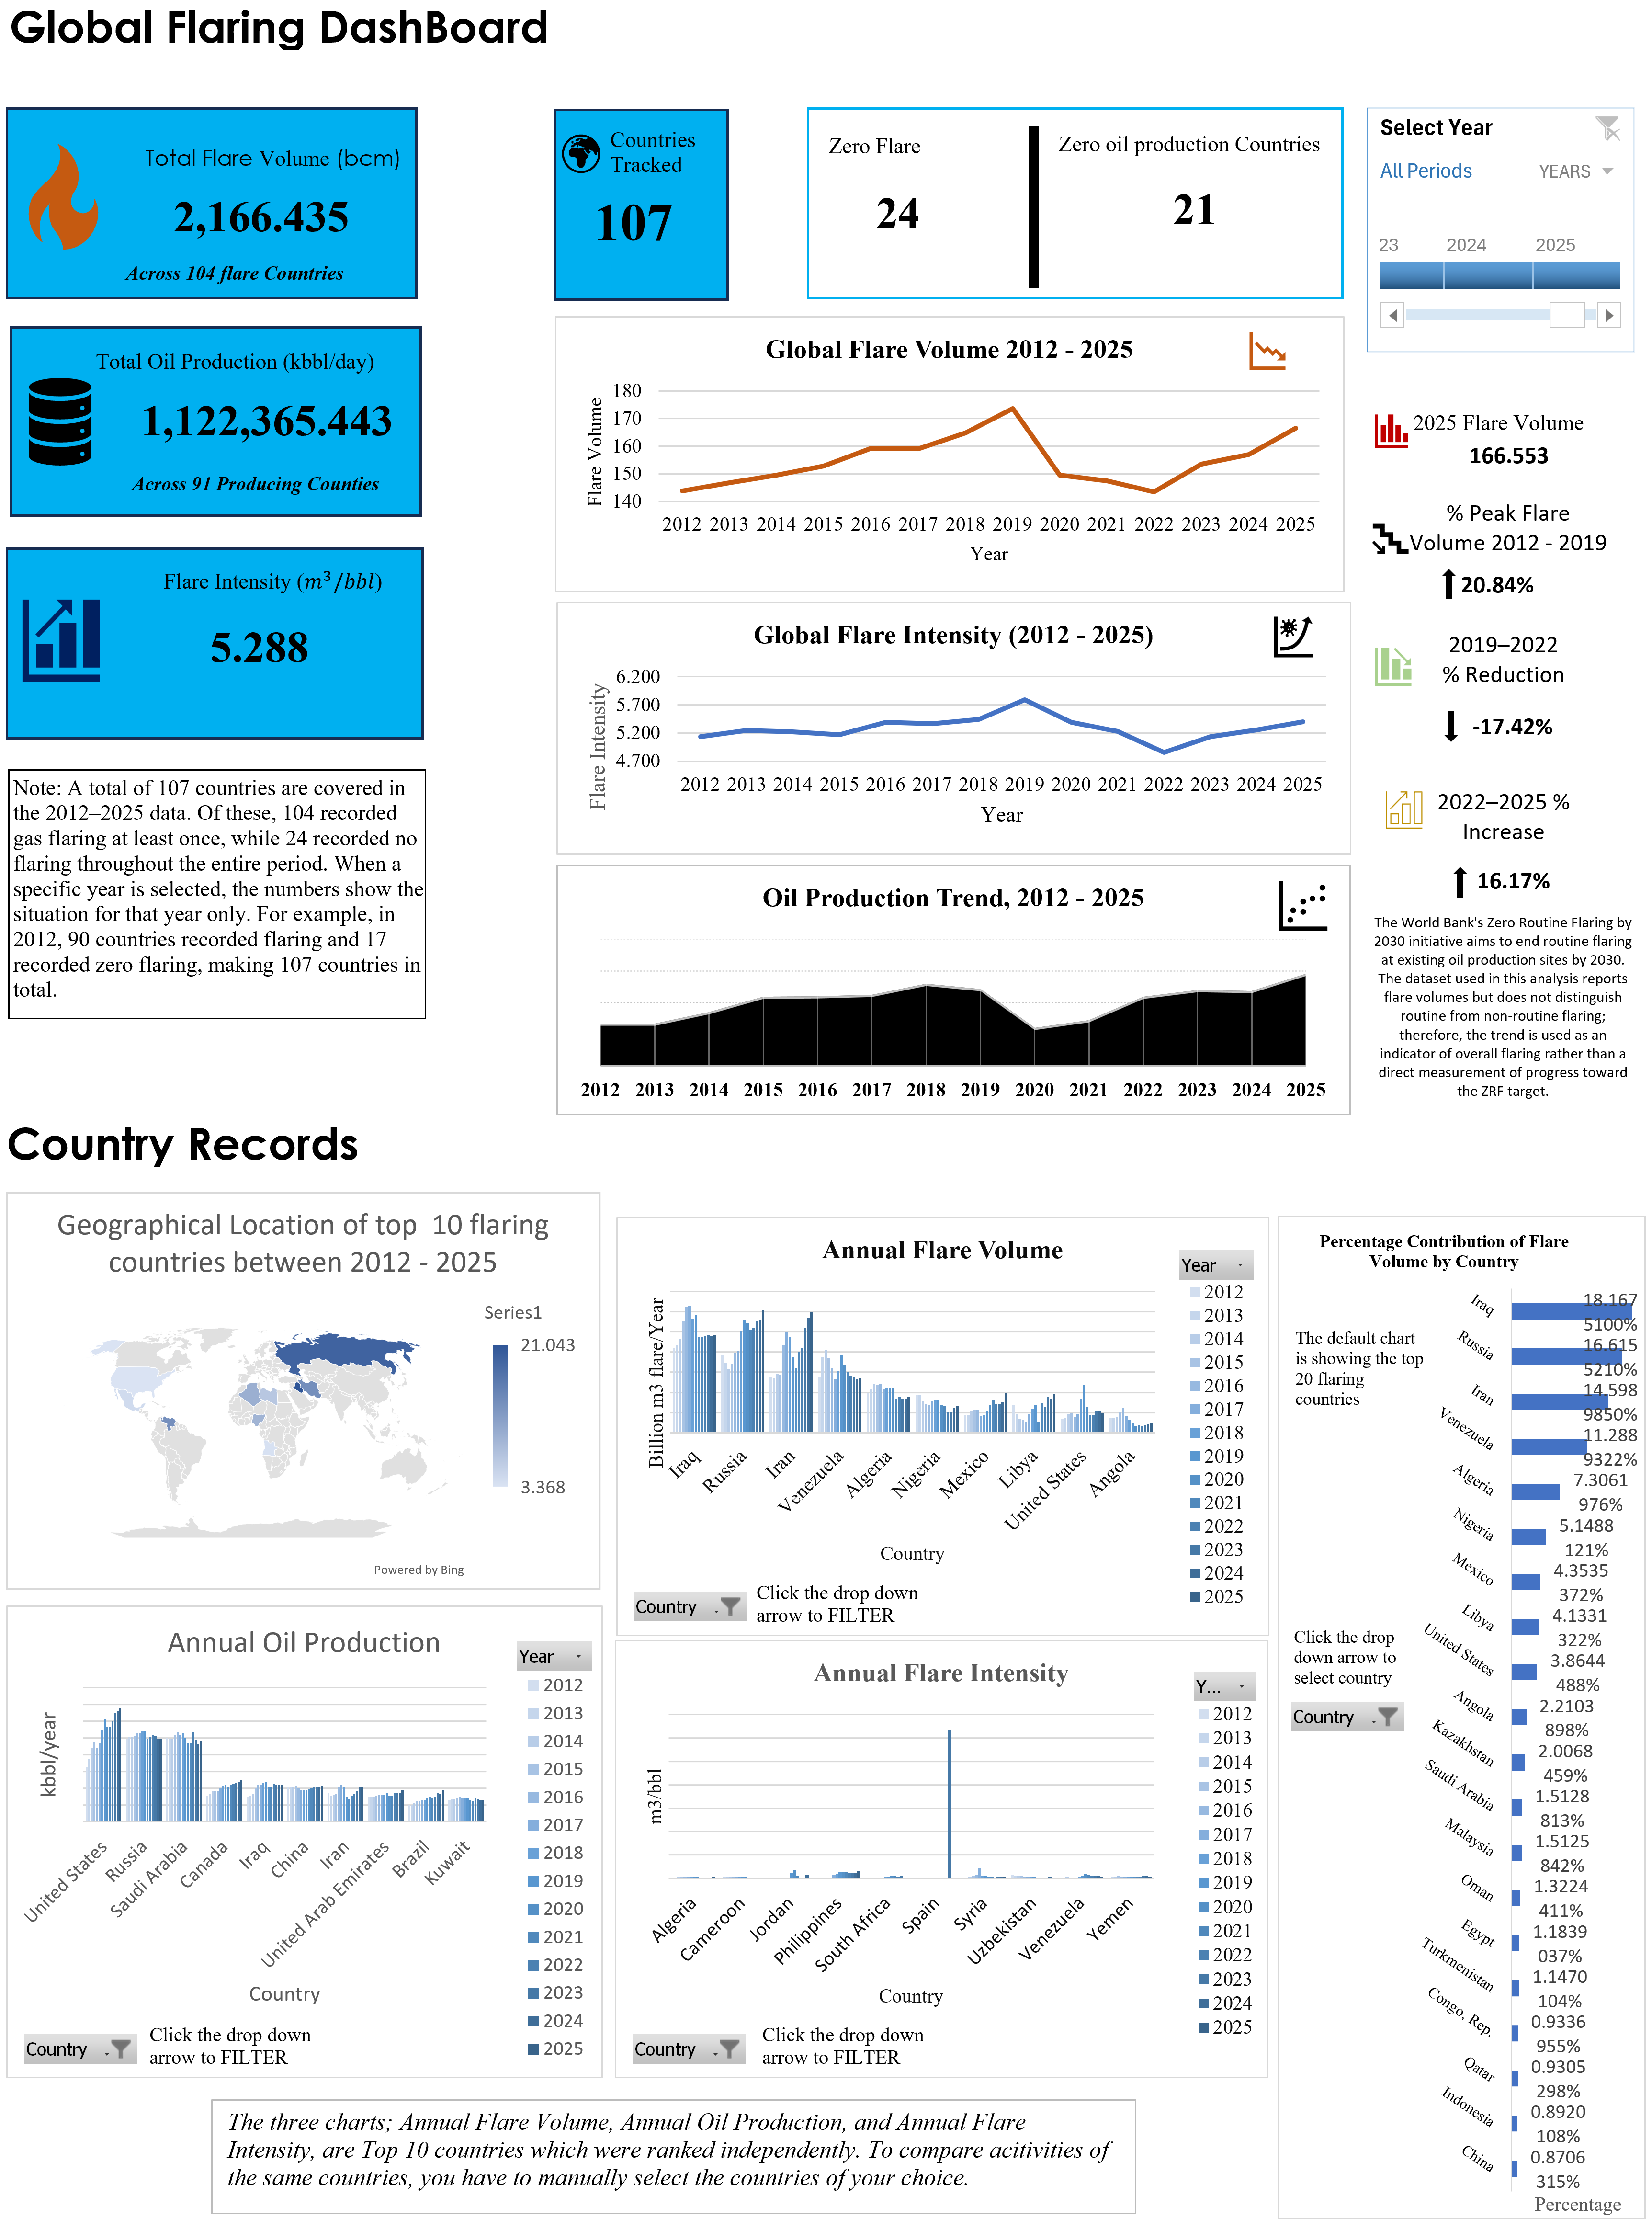
A single-page interactive Excel dashboard on global gas flaring and oil production from 2012 to 2025. It tracks flare volume, flare intensity and oil output, then breaks them down by country. It also relates the trends to the World Bank’s Zero Routine Flaring by 2030 (ZRF) initiative.
Headline KPIs
- Total flare volume: 2,166.435 bcm across 104 flaring countries.
- Total oil production: 1,122,365.443 kbbl/day across 91 producing countries.
- Flare intensity: 5.288 m³/bbl.
- Countries tracked: 107. A further card shows 24 countries with zero flaring and 21 with zero oil production.
- 2025 flare volume: 166.553 bcm.
- Change indicators:
- Flare volume peaked in 2019, about 20.84% above the 2012 level.
- It fell 17.42% between 2019 and 2022.
- It rose 16.17% between 2022 and 2025.
Global trends
- Flare volume: It rose steadily from about 144 bcm in 2012 to a peak of about 173 bcm in 2019. It then dropped sharply to a low of about 143 bcm in 2022 and has climbed back to about 166 bcm by 2025.
- Flare intensity: It follows the same shape, peaking in 2019 and hitting its lowest point in 2022.
- Oil production: It dipped in 2020 and has recovered to its highest level by 2025, so flaring and production moved together over the period.
Country records
- A map highlighting the top 10 flaring countries, with Russia the most prominent.
- Top 10 rankings for annual flare volume, annual oil production and annual flare intensity, each filterable by country and year.
- Top 10 flaring countries by volume: Iraq, Russia, Iran, Venezuela, Algeria, Nigeria, Mexico, Libya, the United States and Angola.
- A bar chart of each country’s percentage contribution to global flare volume. Iraq (about 18%), Russia (about 17%) and Iran (about 15%) lead.
- The three ranked charts are sorted independently, so users must pick the same countries manually to compare them.
Key takeaways
- Flaring is concentrated in a handful of countries; the top 3 account for roughly half of global flare volume.
- The 2020–2022 reduction was not sustained, because volumes have risen again since 2022.
- Flaring volume and flaring intensity do not always move together: some countries with low volume still show high intensity.
- The data cannot separate routine from non-routine flaring, so the trend is a general indicator of flaring and not a direct measure of progress toward the ZRF target.
Tools and skills demonstrated
- Excel (Power Query, pivot tables and charts, slicers and drop-down filters, map chart, KPI cards)
- Time-series and country-level comparative analysis
- Data storytelling, including notes explaining how to read the filters and the limits of the dataset
Comment (0)
Other projects by Wilfred


Talentdigit Resources Limited is a digital training and consulting firm that equips individuals and organizations with digital skills training.


Leave your thought here