
Electronics Retailer Analysis
Project related images. Click to view
Sales Analysis
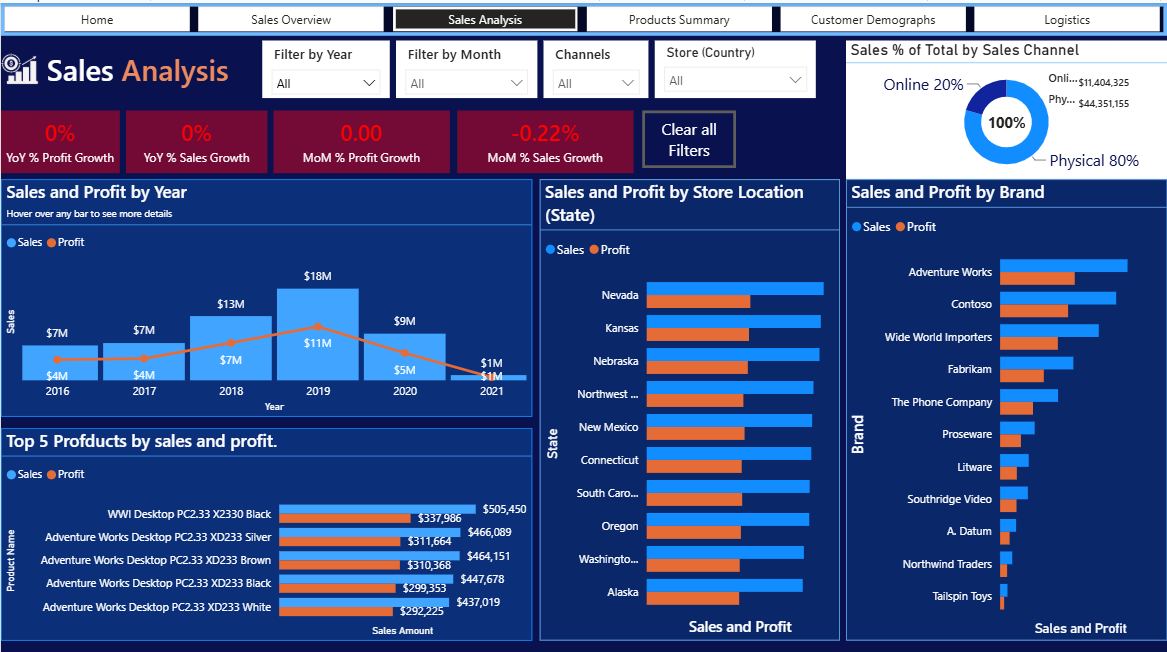
This is the Sales Analysis page of the Electronics Retailer dashboard, on a dark navy background. A navigation bar runs across the top with six buttons (Home, Sales Overview, Sales Analysis, Products Summary, Customer Demographics and Logistics), and Sales Analysis is highlighted as the current page.
Below the page title are four white drop-down filters, all set to “All”: Filter by Year, Filter by Month, Channels and Store (Country). A “Clear all Filters” button sits beside them. At the top right, a donut chart titled “Sales % of Total by Sales Channel” splits sales into Online (20%, $11,404,325) and Physical (80%, $44,351,155). It reads 100% in the centre because no channel is selected.
A row of four red growth cards shows YoY % Profit Growth (0%), YoY % Sales Growth (0%), MoM % Profit Growth (0.00) and MoM % Sales Growth (-0.22%). These sit at or near zero because no year or month is selected.
The main area holds four charts, each plotting sales in blue and profit in orange:
- Sales and Profit by Year (columns for sales, a line for profit, with a “hover over any bar” tooltip):
- 2016: $7M sales, $4M profit
- 2017: $7M sales, $4M profit
- 2018: $13M sales, $7M profit
- 2019 (the peak): $18M sales, $11M profit
- 2020: $9M sales, $5M profit
- 2021: $1M sales, $1M profit. This bar is small because the data stops on 20 February 2021.
- Top 5 Products by sales and profit:
- WWI Desktop PC2.33 X2330 Black leads with $505,450 sales and $337,986 profit.
- The next four are Adventure Works Desktop PC2.33 XD233 models: Silver ($466,089 / $311,664), Brown ($464,151 / $310,368), Black ($447,678 / $299,353) and White ($437,019 / $292,225).
- Sales and Profit by Store Location (State): ranked bars for Nevada, Kansas, Nebraska, Northwest territories, New Mexico, Connecticut, South Carolina, Oregon, Washington and Alaska. The bars are close in length, so sales are spread fairly evenly across locations.
- Sales and Profit by Brand, in descending order: Adventure Works, Contoso, Wide World Importers, Fabrikam, The Phone Company, Proseware, Litware, Southridge Video, A. Datum, Northwind Traders and Tailspin Toys.
Comment (0)
Other projects by Wilfred



Talentdigit Resources Limited is a digital training and consulting firm that equips individuals and organizations with digital skills training.


Leave your thought here