
ADVENTUREWORKS SALES PERFORMANCE ANALYSIS
Project related images. Click to view
AdventureWorks Sales Performance Analysis
Power BI Project Documentation: Sales, Branch, Returns, Product
and Customer Analysis
Prepared by Blessing Usoroh, Data Analyst | 29
October 2026
1. Project Overview
This project analyses the AdventureWorks sample data set,
which covers sales, branches, returns, products and customers. The data was
cleaned in Power Query, organised into a star-schema model, and analysed with
DAX measures in Power BI. The result is a set of interactive dashboards that
show revenue, profit, branch performance against targets, product returns,
product profitability and customer behaviour, so that a business can monitor
its performance from one place.
The report has five analysis pages: Sales Analysis,
Branch Analysis, Returns Analysis, Product Analysis and Customer Analysis. Each
page has KPI cards, charts, slicers for filtering, and a short list of insights
and recommendations.
2. Problem Statement
Sales, branch, returns, product and customer data are
usually kept in separate tables and reports, so it is hard to see how the
business is really performing. Managers need one tool that answers practical
questions: Where do revenue and profit come from? Which branches meet their
targets? Why do customers return products? Which products earn the most, and
who are the customers behind the sales?
3. Aim and Objectives
Aim: to analyse
the sales data, evaluate business performance, find the main drivers of
revenue, profit and returns, and produce insights that support decisions.
•
Track revenue, cost, profit
and orders over time.
•
Compare each branch's
revenue with its target and review its profit and return rate.
•
Find out why products are
returned, which products are returned most, and where.
•
Identify the most and least
profitable products, categories and subcategories.
•
Understand who the
customers are by gender, age, occupation, income and when they joined.
•
Turn the findings into
clear recommendations.
Data and Data Model
The model has five source tables and a calendar table.
Sales is the fact table, and the other tables describe it.
|
Table |
Role |
Key fields |
|
Sales |
Fact table |
Order Date,
Order Quantity, Product Key, Customer Key, Branch, Sales Amount, Product
Cost, Tax Amount, Discount Amount |
|
Products |
Dimension |
Product Key,
Product Name, Category, Subcategory, Product Line, Colour, Size, List Price,
Selling Price |
|
Customers |
Dimension |
Customer Key,
Gender, Birth Date, Occupation, Yearly Income, Marital Status, Date of First
Purchase |
|
Branch |
Dimension |
Branch,
Latitude, Longitude, Manager, Target |
|
Returns |
Fact table |
Branch,
Product Key, Reasons, Return Date, Return Quantity |
|
Calendar |
Date table |
Date, Month, Month Name, Quarter, Year |
Relationships (many-to-one, single direction): Sales to
Products, Customers, Branch and Calendar; Returns to Products, Branch and
Calendar. Branch and Products therefore filter both Sales and Returns, which
makes return rates by branch and product possible.
Tools and Techniques
•
Power BI Desktop: data modelling, report design, slicers, tooltips, gauge
and matrix visuals, and page navigation buttons.
•
Power Query: loading the files, fixing data types and dates, and
removing unneeded records.
•
DAX: measures for revenue, cost, profit, margin, returns,
targets and customers.
•
Star-schema modelling: fact tables linked to dimension tables for clear and fast
filtering.
Key DAX Measures
|
Measure |
DAX formula |
|
Profit |
Profit =
[Revenue] - [Cost] |
|
Profit % |
Profit % =
DIVIDE([Profit], [Revenue]) |
|
Total
Returns |
Total Returns
= SUM(Returns[returnquantity]) |
|
Quantity
Sold |
Quantity Sold
= SUM(Sales[orderquantity]) |
|
Return Rate |
Return Rate =
DIVIDE([Total Returns], [Quantity Sold]) |
|
Return
Records |
Return Records
= CALCULATE(COUNTROWS(Returns), Returns[returnquantity] > 0) |
|
Total
Target |
Total Target =
SUM(Branch[target]) |
|
Target
Achievement % |
Target
Achievement % = DIVIDE([Revenue], [Total Target]) |
|
Active
Customers |
Active
Customers = DISTINCTCOUNT(Sales[customerkey]) |
|
Revenue per
Customer |
Revenue per Customer = DIVIDE([Revenue], [Active Customers]) |
Dashboard Pages and Findings
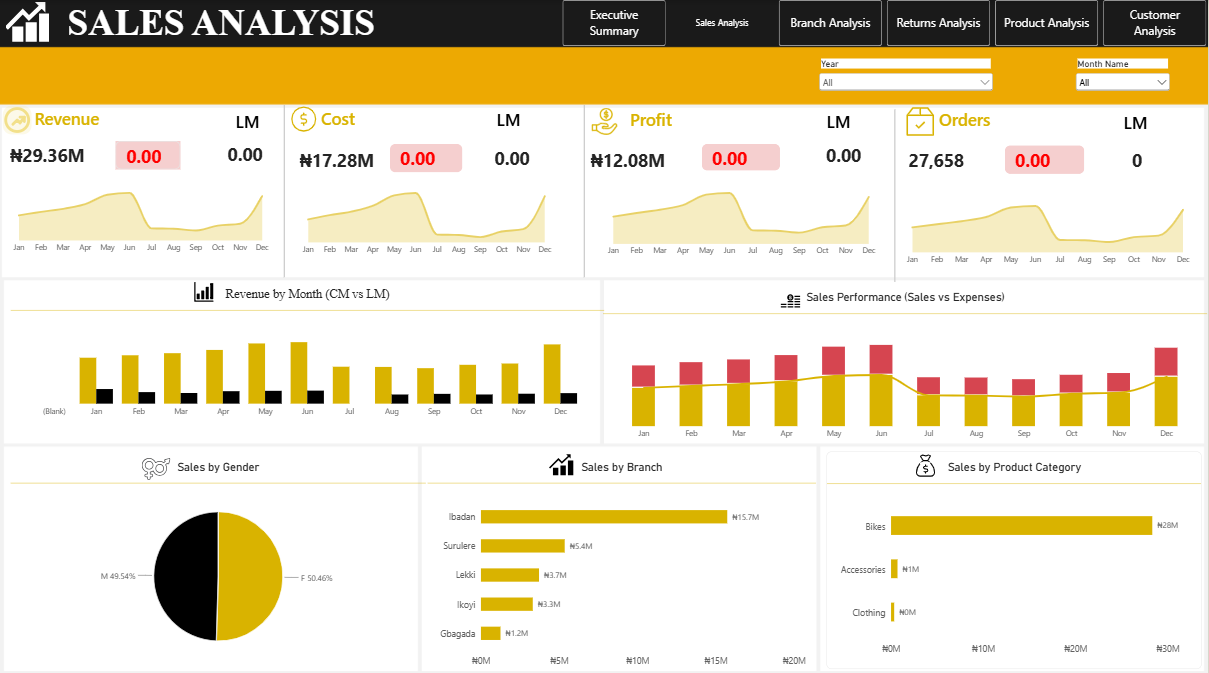
Sales Analysis
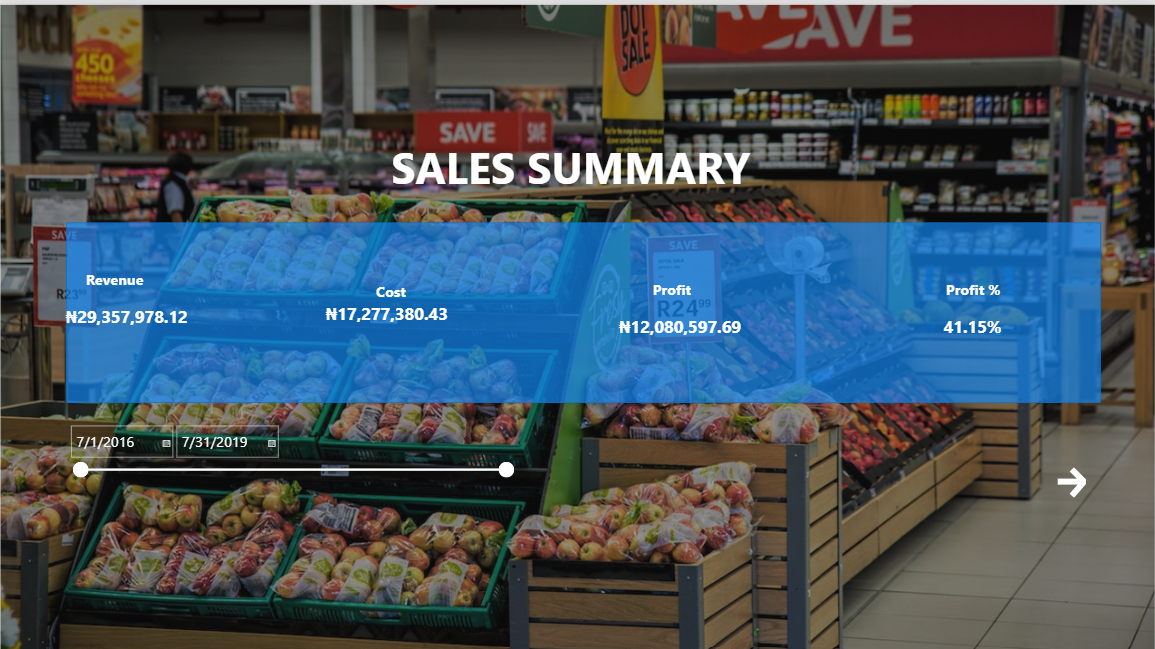
The page shows total revenue of ?29.36M, cost of ?17.28M,
profit of ?12.08M and 27,658 orders, with charts by month, gender, branch and
product category.
•
Monthly revenue rises from
January to June, drops in July, stays lower through October, then climbs again
in November and December.
•
Bikes bring in about ?28M
of the ?29.36M in revenue. Accessories contribute about ?1M and clothing very
little.
•
Ibadan is the largest
branch at ?15.7M, followed by Surulere (?5.4M), Lekki (?3.7M), Ikoyi (?3.3M)
and Gbagada (?1.2M).
•
Sales are split almost
evenly between female (50.46%) and male (49.54%) customers.
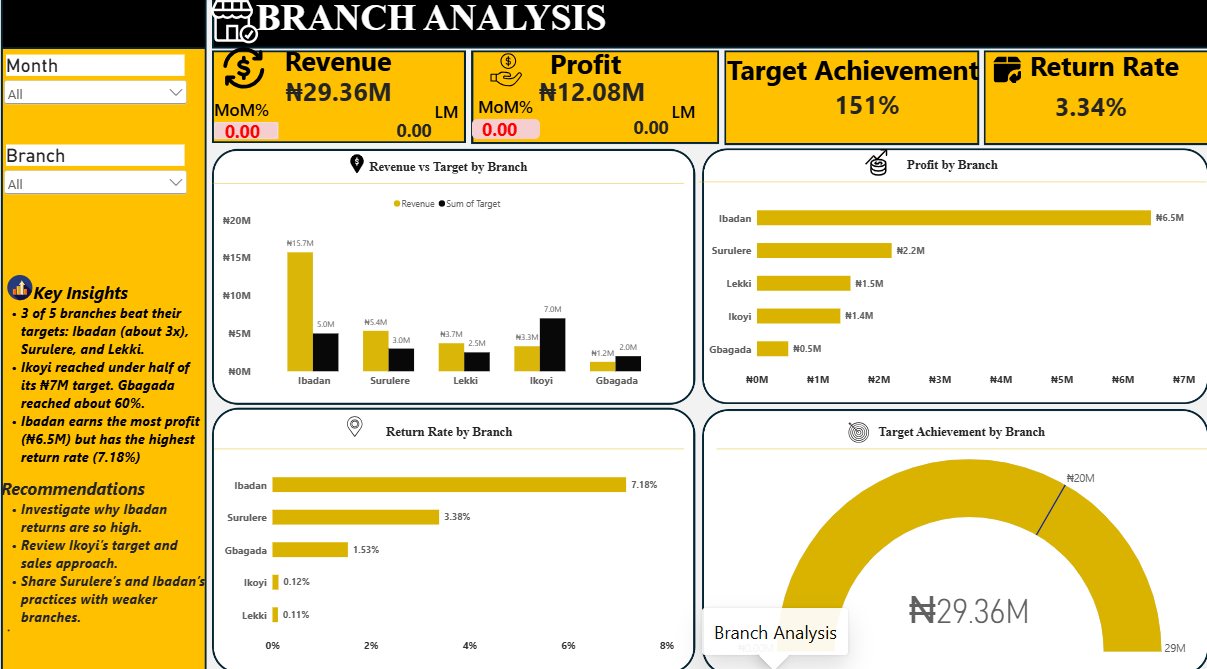
Branch Analysis
The company achieved 151% of its combined target, and the
return rate across all branches is 3.34%.
•
Three of the five branches
beat their targets: Ibadan (about 3 times its ?5.0M target), Surulere (?5.4M
against ?3.0M) and Lekki (?3.7M against ?2.5M).
•
Ikoyi reached under half of
its ?7.0M target (?3.3M), and Gbagada reached about 60% of its ?2.0M target
(?1.2M).
•
Ibadan earns the most
profit (?6.5M) but also has the highest return rate (7.18%). Lekki and Ikoyi
have return rates of about 0.1%.
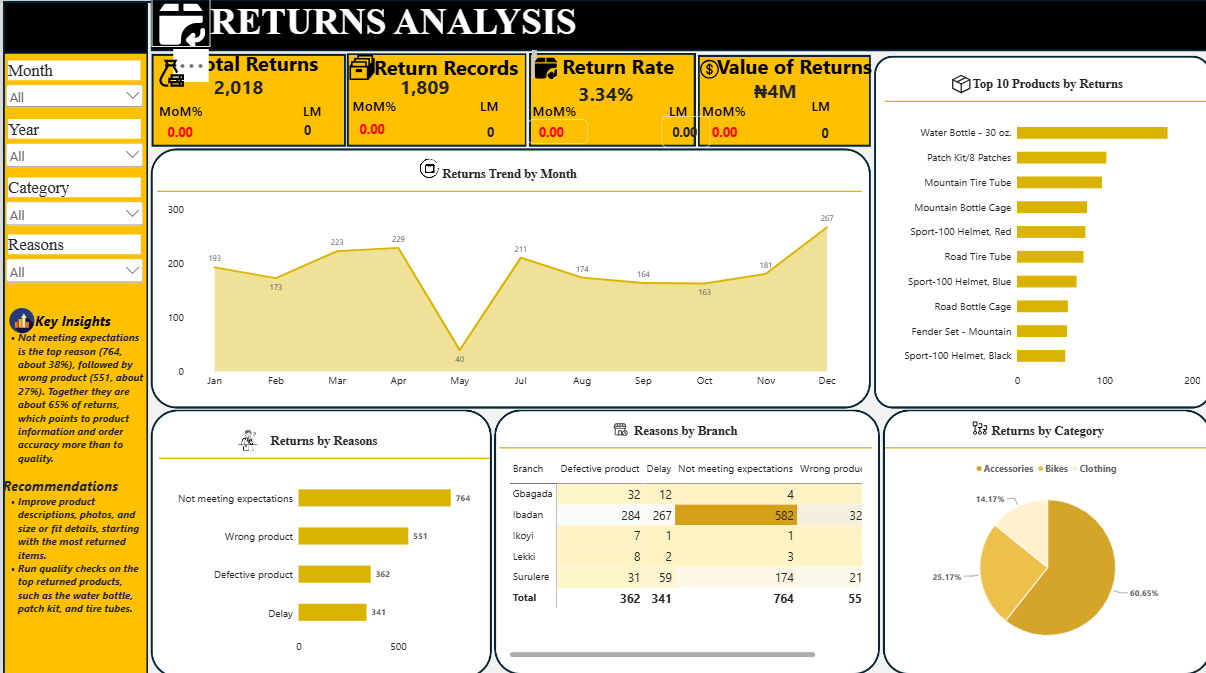
Returns Analysis
In total 2,018 units were returned across 1,809 return
records, a return rate of 3.34% and a value of about ?4M.
•
The main reasons are not
meeting expectations (764, about 38%) and wrong product (551, about 27%),
together about 65% of returns. Defective product (362) and delay (341) follow.
•
Ibadan accounts for most of
the returns under defective product, delay and not meeting expectations.
•
Accessories make up 60.65%
of returns, then bikes (25.17%) and clothing (14.17%). The Water Bottle (30
oz.), Patch Kit and Mountain Tire Tube are the most returned products.
•
Returns peak in December
(267) and drop sharply in May (40). The monthly chart shows no returns for
June, which should be checked against the source data.
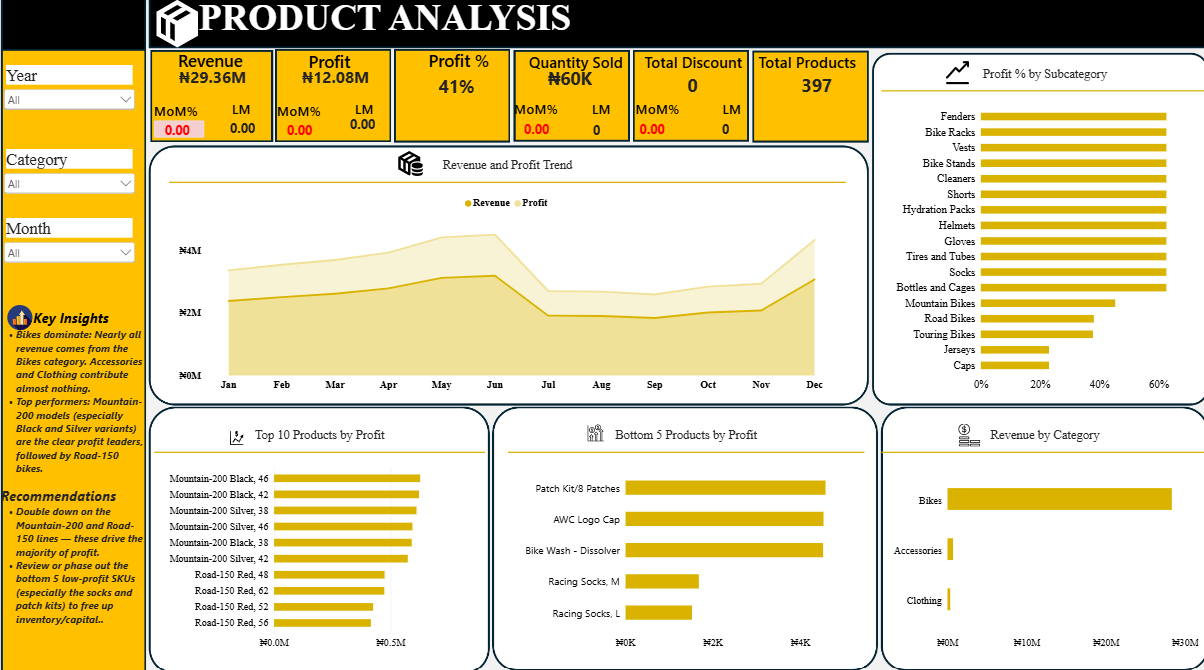
Product Analysis
The business sells 397 products with a profit margin of
41%, and about 60,000 units were sold.
•
Bikes dominate revenue.
Accessories and clothing add very little.
•
Profit margins differ by
subcategory. Many accessory and clothing subcategories earn about 62%, while
mountain bikes earn about 45%, road bikes about 38% and touring bikes about
37%. Jerseys and caps are lowest, at about 22% to 23%.
•
The Mountain-200 models
(Black and Silver) are the profit leaders, followed by the Road-150 models.
•
The five lowest-profit
products are the Patch Kit, AWC Logo Cap, Bike Wash, and Racing Socks in sizes
M and L.
Customer Analysis
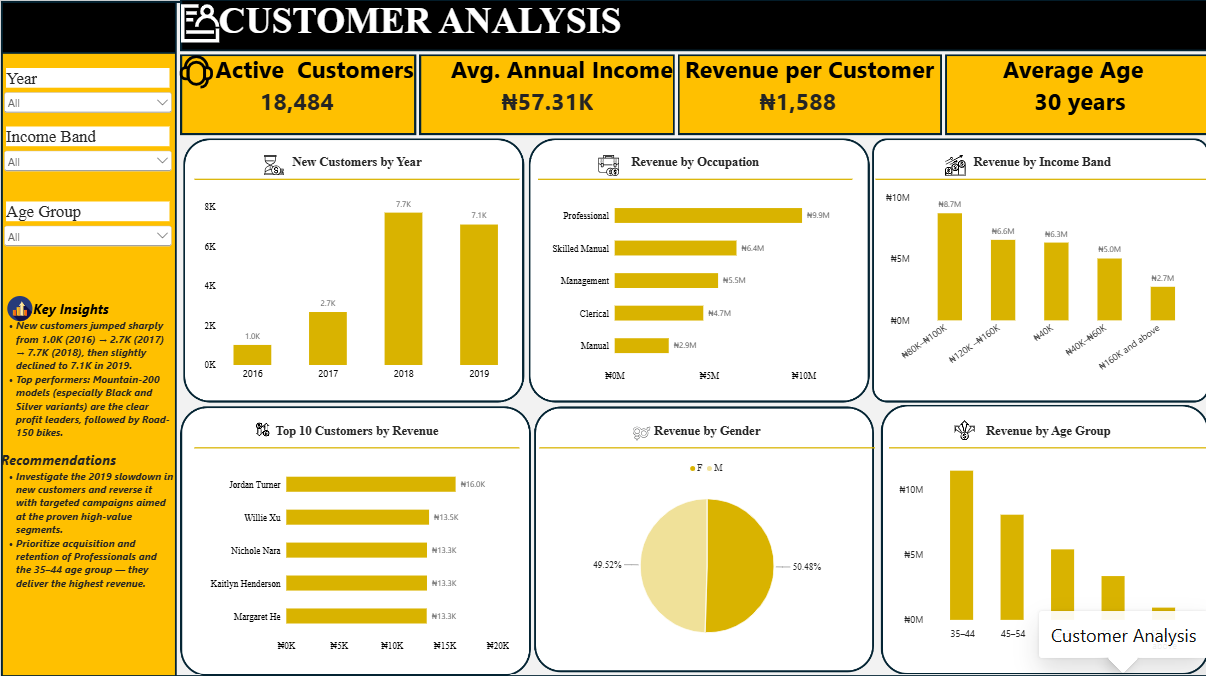
The business has 18,484 active customers, with revenue of
?1,588 per customer, an average annual income of ?57.31K and an average age of
30.
•
New customers rose from
1.0K in 2016 to 2.7K in 2017 and 7.7K in 2018, then fell slightly to 7.1K in
2019.
•
Professionals bring in the
most revenue (?9.9M), followed by skilled manual (?6.4M) and management (?5.5M)
occupations.
•
Revenue is highest in the
?80K to ?100K income band (?8.7M) and the 35 to 44 age group.
•
The top customers each
contribute roughly ?13K to ?16K, so revenue is spread widely and not held by a
few buyers.
Key Insights
1.
Profit is healthy: revenue of ?29.36M and profit of ?12.08M give a margin of
41%.
2.
Revenue is seasonal: it builds to a peak around May and June, falls in July,
and rises again at the end of the year.
3.
Bikes carry the
business: about 95% of revenue comes
from bikes, yet bike margins (about 37% to 45%) are lower than those of
accessories and clothing (about 62% on many lines).
4.
Ibadan is both the best
and the riskiest branch: it earns more
than half of the revenue and profit but has a 7.18% return rate, far above the
other branches.
5.
Branch results are
uneven: three branches beat target,
while Ikoyi and Gbagada fell short.
6.
Returns point to product
information and order accuracy: about
65% of returns are for products that did not meet expectations or were the
wrong product.
7.
Accessories are returned
most: they make up 60.65% of returns,
led by the water bottle, patch kit and tire tubes.
8.
Customer growth slowed
in 2019: after rapid growth to 2018, new
customers dipped, and the best revenue comes from professionals and customers
aged 35 to 44.
Recommendations
1.
Investigate Ibadan's
returns. Review fulfilment, supplier
quality and delivery there, since it drives most returns in every reason.
2.
Reduce returns caused by
expectations and wrong products. Improve
product descriptions, photos and size details, and tighten order picking and
product matching.
3.
Check the most returned
accessories. Run quality checks with
suppliers on the water bottle, patch kit and tire tubes.
4.
Support weaker branches.
Review Ikoyi's target and sales
approach, support Gbagada, and share the practices of Ibadan and Surulere.
5.
Focus on the profit
leaders. Prioritise the Mountain-200 and
Road-150 lines, and review or phase out the five lowest-profit products.
6.
Grow higher-margin
lines. Promote accessories and clothing
together with bike sales, since they earn higher margins.
7.
Reverse the 2019
customer slowdown. Run targeted
campaigns, and focus on professionals and customers aged 35 to 44.
8.
Plan for the December
peak. Prepare stock, staff and support,
and confirm the low May and missing June return figures.
Comment (0)
Other projects by Blessing


Talentdigit Resources Limited is a digital training and consulting firm that equips individuals and organizations with digital skills training.


Leave your thought here