
Sales Summary Dashboard
Project related images. Click to view
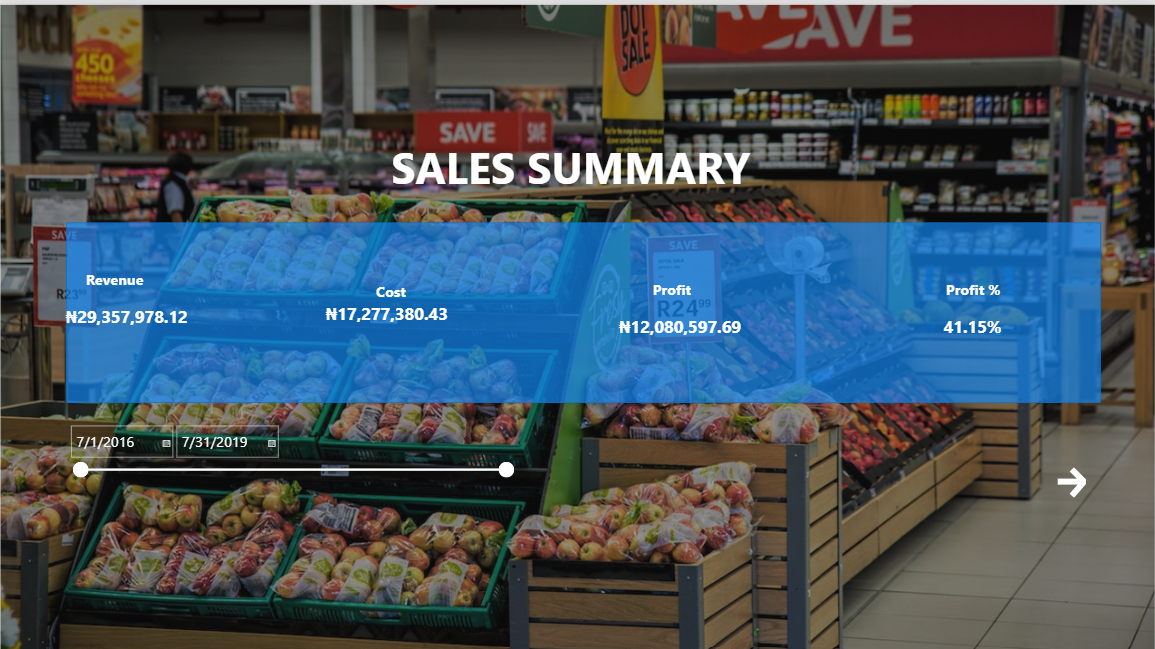
Sales Dashboard Summary
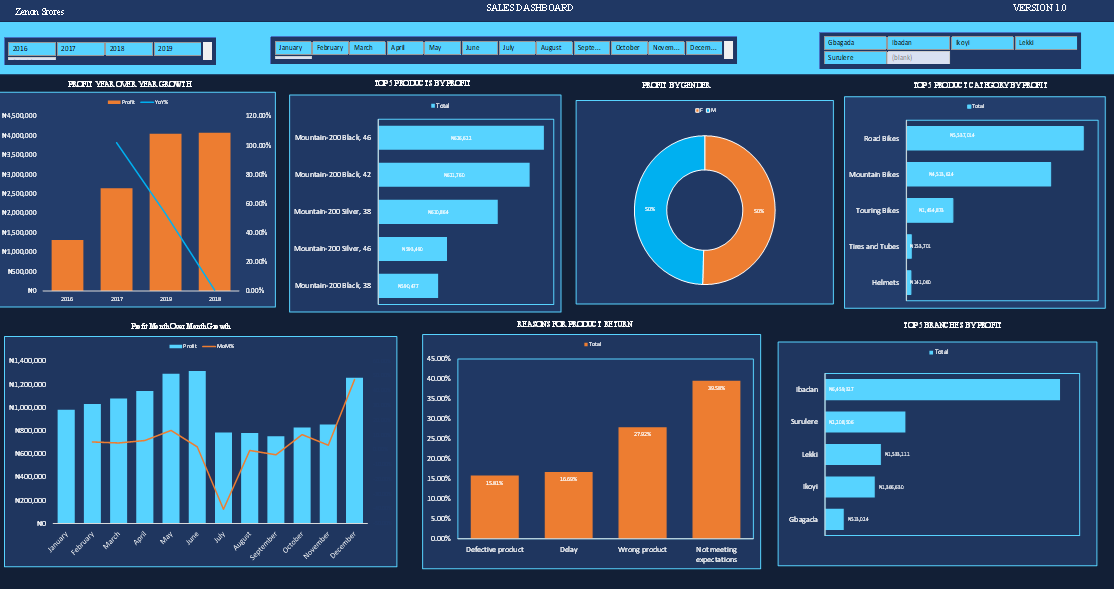
I designed this interactive Sales Dashboard using Power BI to provide a clear overview of business sales performance and profitability.
The dashboard highlights key performance indicators (KPIs), including Revenue, Cost, Profit, and Profit Margin, enabling users to quickly assess overall financial performance. It also includes an interactive date slicer, allowing users to filter the dashboard and analyse sales performance across different time periods.
For the period displayed, the dashboard shows total revenue of ?29.36 million, total cost of ?17.28 million, and profit of ?12.08 million, resulting in a 41.15% profit margin.
This project demonstrates my ability to transform sales data into a visually appealing and easy-to-understand dashboard, create meaningful KPIs, apply interactive filtering, and present business insights that can support data-driven decision-making.
Skills demonstrated: Power BI, Data Analysis, Data Visualization, KPI Development, Dashboard Design, Data Filtering, and Business Insights.
Comment (0)
Other projects by Blessing


Talentdigit Resources Limited is a digital training and consulting firm that equips individuals and organizations with digital skills training.


Leave your thought here