
Kaito Electronic Sales Analysis
Project related images. Click to view
Electronics Retailer Analysis
Power BI Sales and Performance Dashboard
Overview
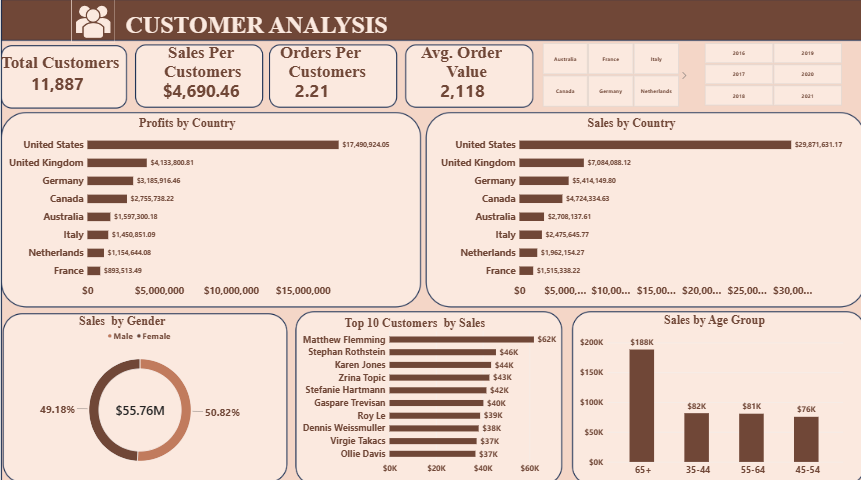
This project brings sales, product, customer, store, and delivery data for an electronics retailer into one interactive Power BI dashboard. Commercial and finance teams can monitor revenue, profit, and operations in one place. The dashboard moves from a company-wide summary to the questions that drive decisions: which products and brands earn the most, which countries and stores are most profitable, who the customers are, and how performance changes month by month and year by year.
Problem Statement
Retail teams often track revenue, cost, and customer data in separate spreadsheets and point reports, so it is hard to see one consistent, current picture of performance. This project provides a single tool that lets stakeholders filter by year, month, country, state, and category, and see the effect on revenue, profit, order volume, and customer behaviour straight away.
Aim
To analyse sales transaction data, evaluate business performance, find the main drivers of revenue and profit, and produce insights that support strategic decisions.
Objectives
- Examine sales and revenue trends over time and identify major changes
- Compare revenue with profit across different business dimensions
- Identify high- and low-performing brands and products
- Assess sales and profit by country, state, and store location
- Compare online and physical retail performance
- Analyse customer demographics and their link to sales
- Measure month-over-month and year-over-year changes
- Turn the findings into practical recommendations
Data Model
A star schema with one fact table connected to dimension tables.
| Table | Role | Key fields |
|---|---|---|
| Sales | Fact | Order Number, Order Date, Quantity, Sales Amount, Exchange Rate |
| Customers | Dimension | Customer Key, Gender, Birthday, City, Country |
| Products | Dimension | Product Key, Product Name, Brand, Category, Subcategory, Unit Cost USD, Unit Price USD |
| Stores | Dimension | Store Key, Country, State, Store Type, Open Date, Square Meters |
| Date_Table | Calculated | Date, Year, Quarter, Month, Month Name |
| Exchange_Rates | Currency conversion | Currency, Date, Exchange rate |
| Measures | Measures table | All DAX measures, kept in one place |
Tools
Power BI Desktop, Power Query (loading and cleaning five CSV files), DAX, star schema modelling, slicers, and page navigation buttons.
Key Insights
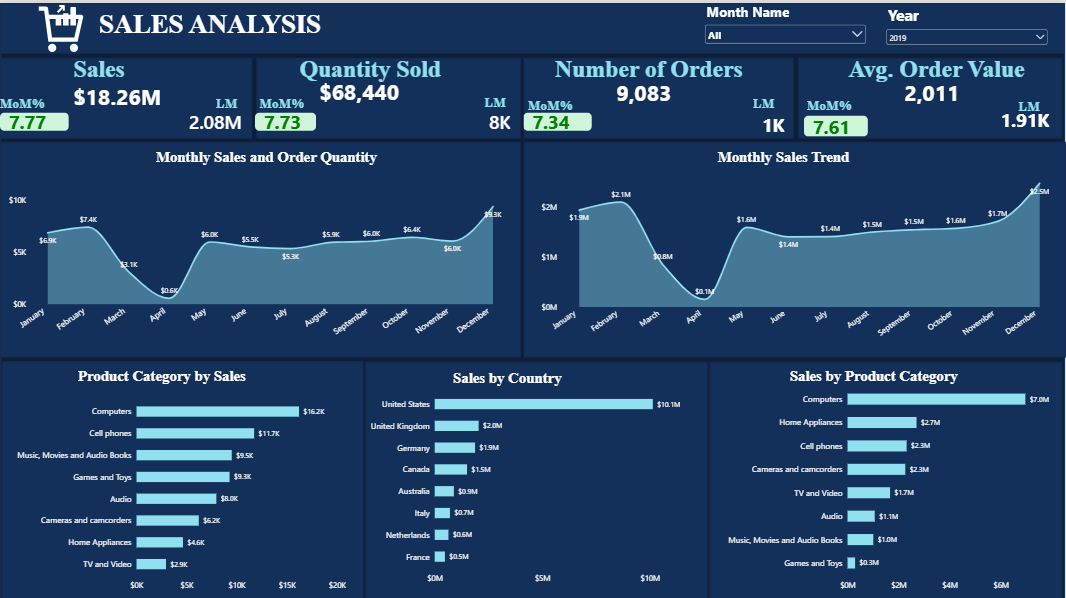
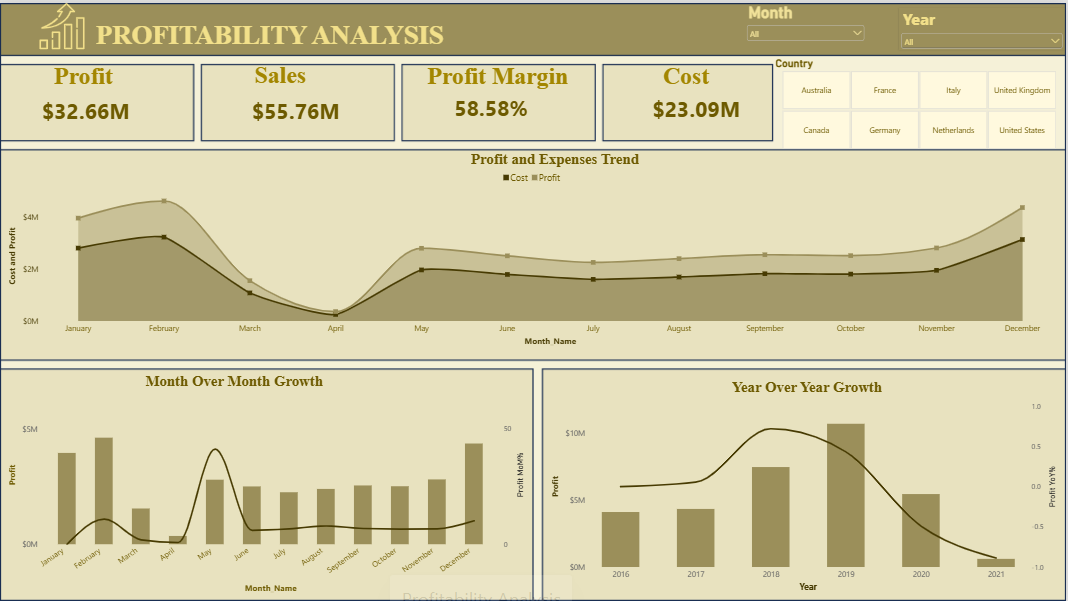
- Trend: Revenue and profit grew steadily from 2016 to 2019, peaked in 2019, then fell considerably through 2021.
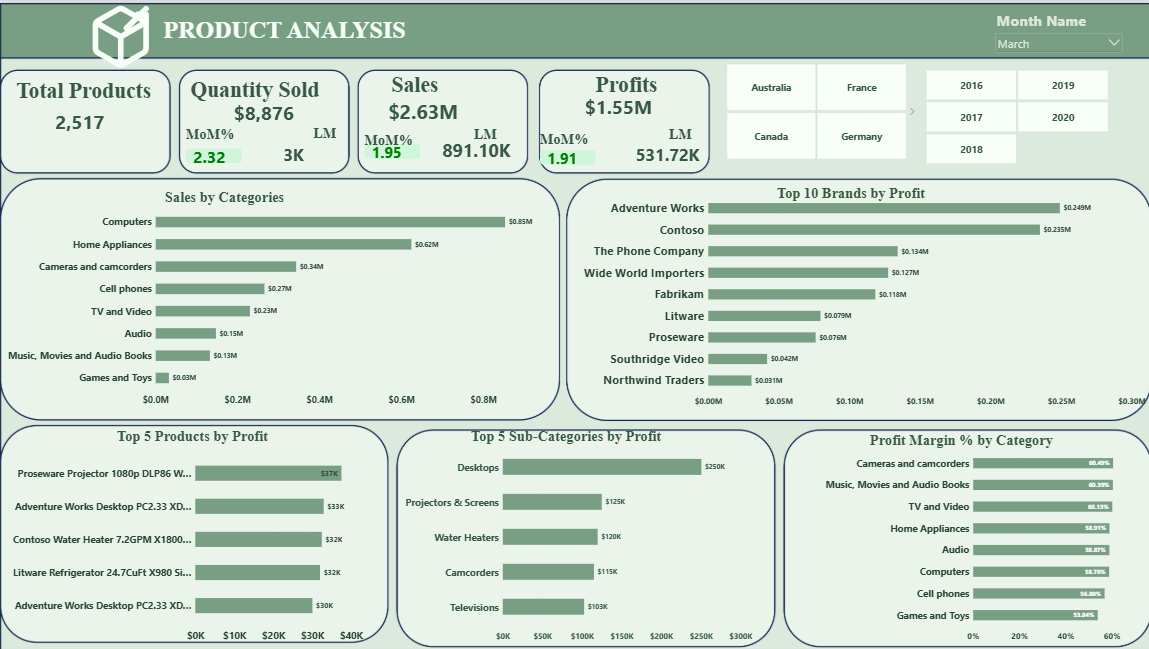
- Brand: Adventure Works remains the primary profit driver overall at $6.4M. It accounts for 27.7% (over a quarter) of the total profit generated across all listed brands. It outpaces second-place Contoso ($4.0M) by 60% (+$2.4M) and generates more profit than the bottom five brands combined ($6.4M vs. $6.0M).
- Product: The 4 Adventure Works models combined account for $1.82M (78%) of the profit generated among these top 5 products. Individual Leader: Despite Adventure Works' brand volume, the single most profitable individual SKU is the WWI Desktop PC2.33 X2330 Black at $0.51M.
- The WWI Desktop PC2.33 X2330 Black is the top product, with about $505K in sales and $338K in profit.
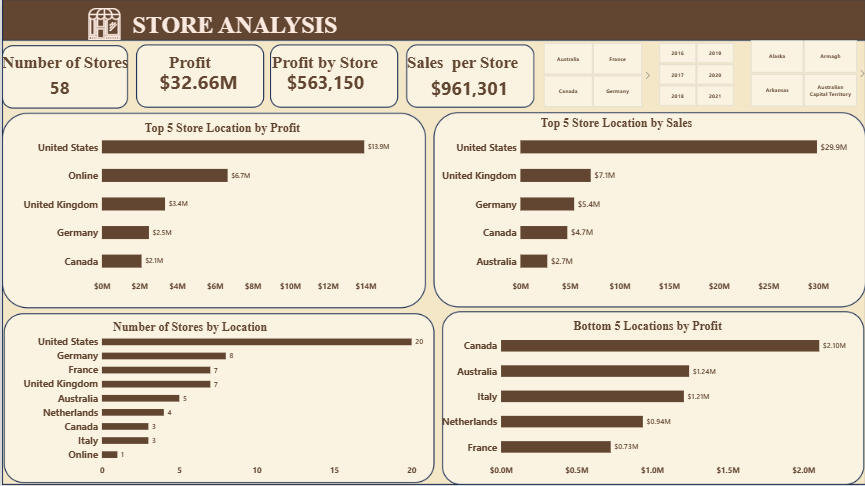
- Geography: The United States is by far the largest revenue/profit driver, generating $13.9M—accounting for approximately 48.6% (nearly half) of the total profit across these top 5 channels.
At $6.7M, the Online store channel is the 2nd most profitable segment overall. - Customers: The customer base is balanced, with 50.7% male and 49.3% female.
Recommendations
- Examine inventory, marketing, or seasonal patterns to address the significant April dip in order volume.
- Cross-sell high-volume low-cost goods (like Audio Books and Accessories) alongside big-ticket hardware items (Computers and Home Appliances) to raise average order values further
- Since desktop computers are generating the vast majority of product-level profit, securing inventory and component supply for these exact 5 configurations is critical.
- Maintain strong retail/online infrastructure in the U.S. while identifying growth levers in Tier-2 regions like the UK, Germany, and Canada.
- Since the U.S. generates nearly half of the total top-5 profit
- Given that the Online channel is the second-largest contributor ($6.7M) and typically carries lower operational/real estate overhead than physical stores, scaling e-commerce capabilities could offer the highest return on investment (ROI)
Comment (0)
Other projects by Blessing


Talentdigit Resources Limited is a digital training and consulting firm that equips individuals and organizations with digital skills training.


Leave your thought here