
Loan Performance Dashboard
Project related images. Click to view
Loan Performance Analysis Dashboard
Tools used: Excel, Power Query, PivotTables, Data Model, Slicers
Project Overview
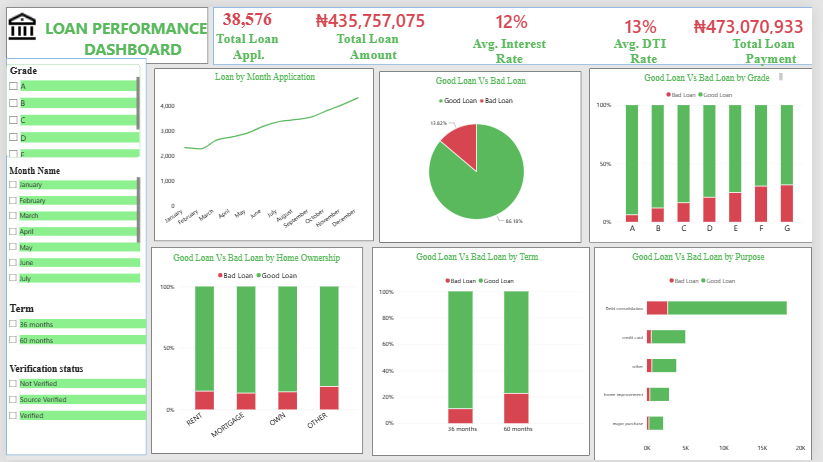
I analyzed 38,576 loan records from 2021 to find out which loans are paid back, which ones go bad, and what the lender can do to lose less money. I cleaned the data in Power Query, analyzed it with PivotTables, and built an interactive Excel dashboard with slicers so the results can be filtered by grade, term, month, and verification status.
Analysis
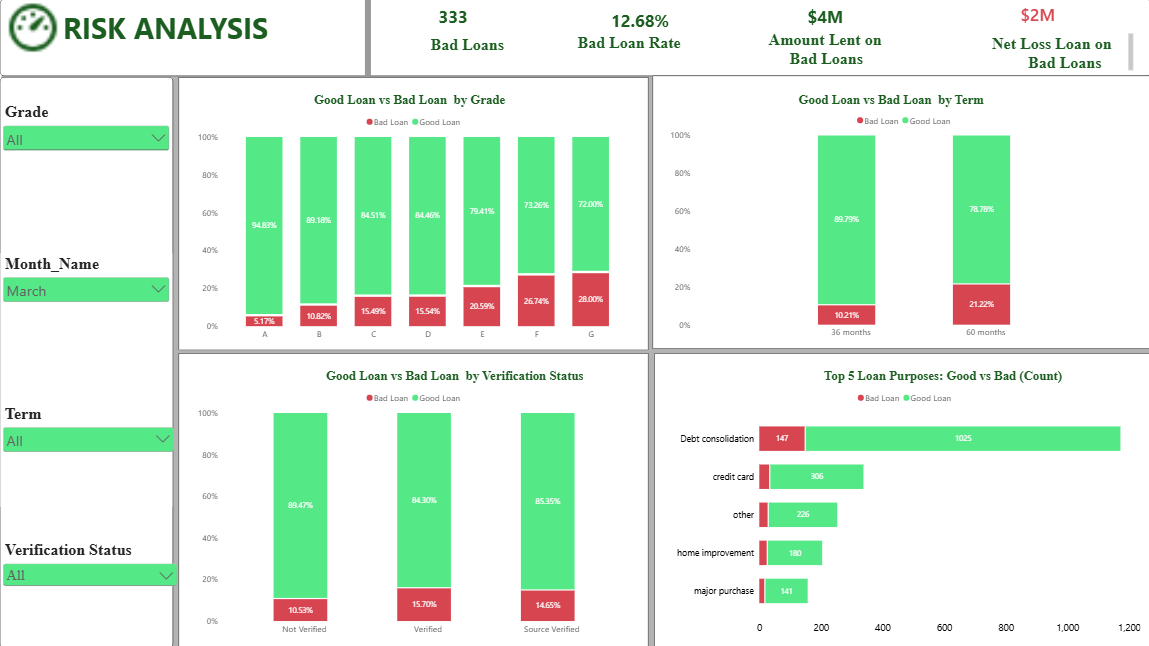
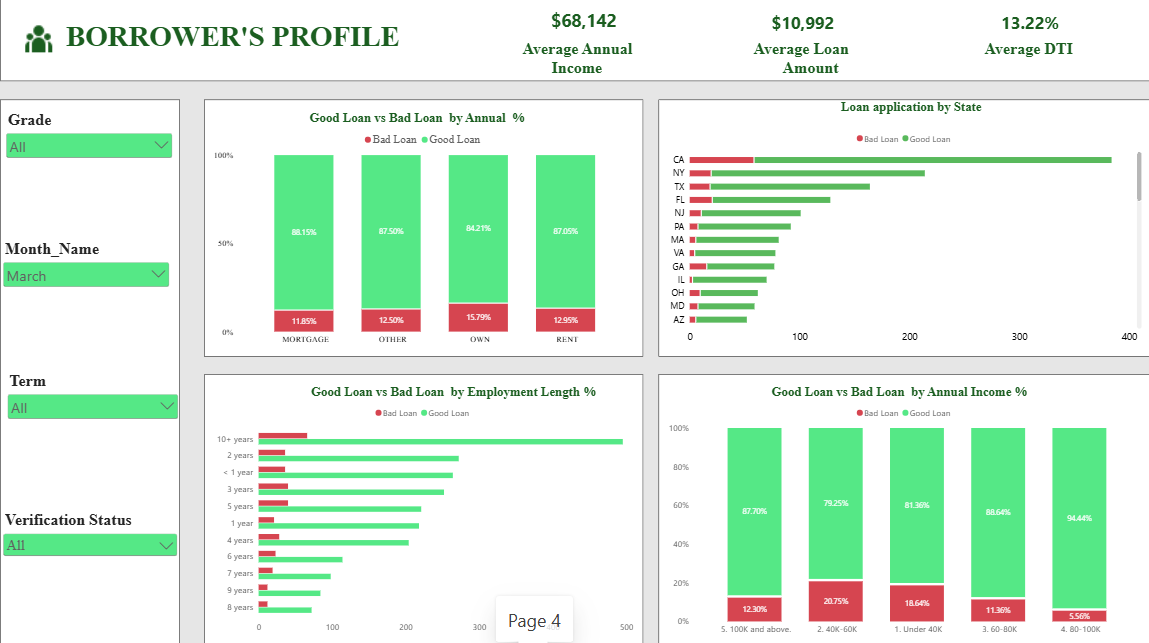
I measured the number and share of good loans (paid back or still current) and bad loans (charged off). I then compared them by loan grade, loan term, loan purpose, home ownership, verification status, and month. I also compared the amount lent with the amount received to measure money lost on bad loans.
Key Insights
- About 86% of loans are good and 14% are bad. That is roughly 1 bad loan in every 7.
- The bank lost about [difference] on bad loans. It lent [funded amount] and received [amount received].
Trends
- Loan applications grew steadily month by month through 2021, so the bank's exposure to risk was rising.
- Nearly half of all loans (47%) were for debt consolidation, and credit card payoff came second (13%).
Patterns
- Risk rises as the grade falls. About 6% of Grade A loans went bad, compared with about 31% of Grade G loans.
- Longer loans are riskier. About 22% of 60-month loans went bad, compared with about 11% of 36-month loans.
- Home ownership made little difference. Bad loan rates stayed between 13% and 15% across groups.
- Verified borrowers did not perform better. They had a 15.7% bad loan rate, compared with 12.2% for unverified borrowers.
Recommendations
- Apply stricter checks, higher interest rates, or smaller loan limits to Grades F and G.
- Give 60-month loans mainly to safer grades, or price them higher.
- Review how income verification is used, since it did not reduce bad loans in this data.
- Monitor debt consolidation loans closely, since they make up nearly half of the portfolio.
Next Steps
- Compare bad loan rates by interest rate and loan amount to see whether they add more insight.
- Track the "current" loans over time to see how many turn bad.
- Test the recommended rules on past data to estimate how much loss they would have prevented.
- Update the dashboard monthly, and add more years of data to confirm the trend.
Comment (0)
Other projects by Blessing
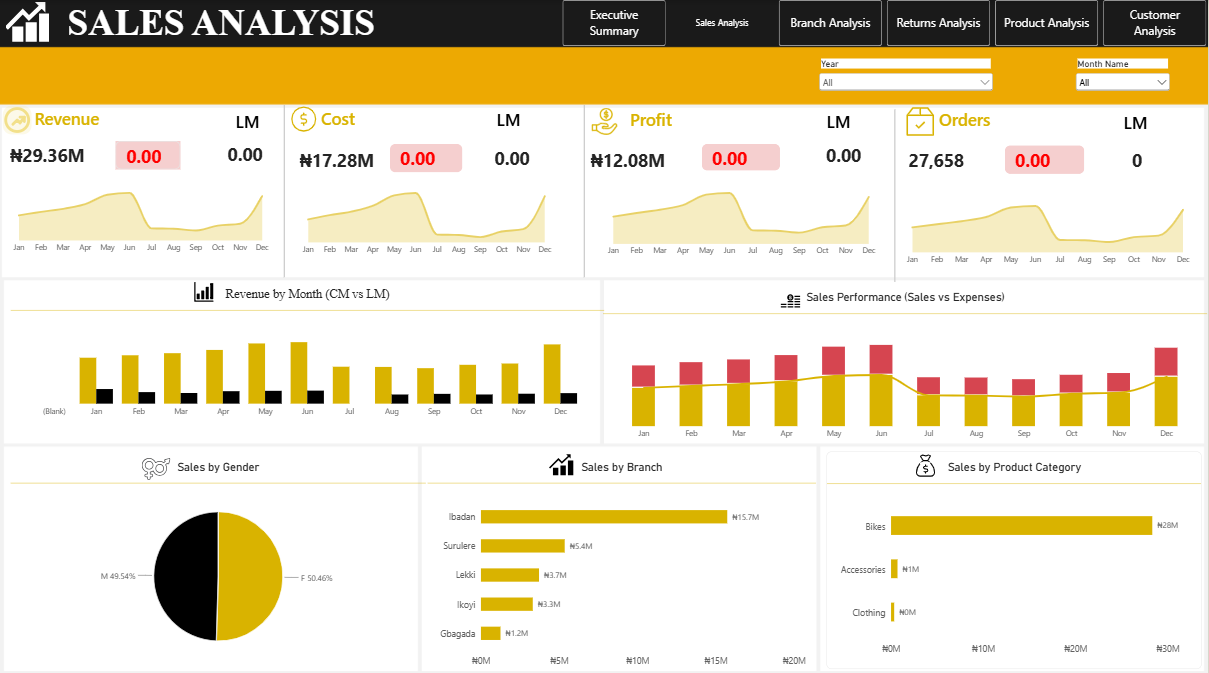

Talentdigit Resources Limited is a digital training and consulting firm that equips individuals and organizations with digital skills training.


Leave your thought here