
Zenon Stores Dashboard
Project related images. Click to view
Sales Performance Dashboard
Project Overview
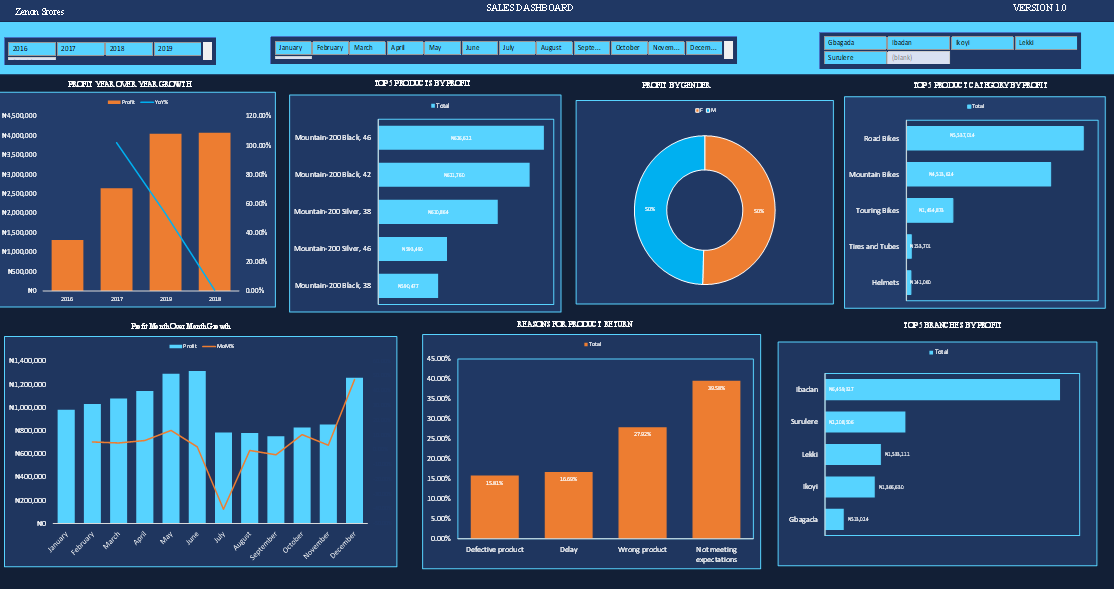
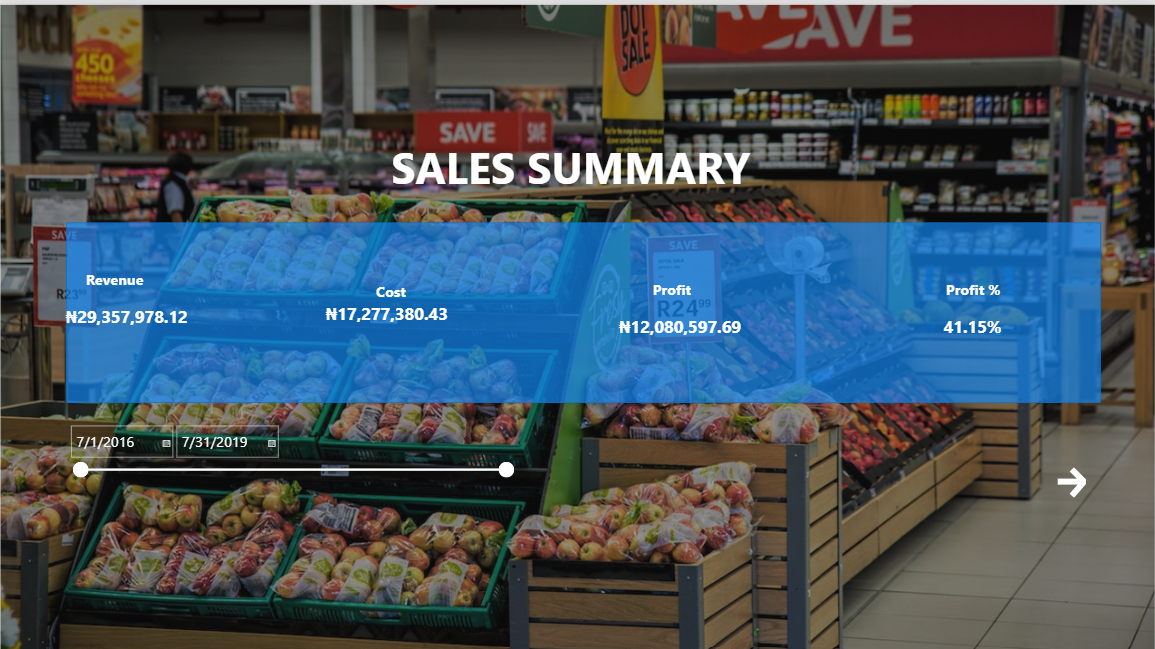
This project involved the development of an interactive Sales Dashboard in Microsoft Excel to analyze business performance across different years, months, products, product categories, branches, gender, and product returns.
The objective was to transform raw sales data into a clear and interactive dashboard that enables users to quickly identify sales trends, profitable products and branches, as well as factors contributing to product returns.
Analysis Performed
The dashboard evaluates several key areas of business performance, including year-over-year profit growth, monthly profit trends, top-performing products, product categories, branch profitability, customer distribution by gender, and reasons for product returns.
Interactive slicers were incorporated for year, month, and branch, allowing the dashboard to be filtered dynamically for more detailed analysis.
Key Insights
The analysis shows that profit increased considerably from 2016 to 2018, with 2018 and 2019 recording the strongest overall profit performance among the years displayed.
At the product level, Mountain-200 Black, 46 emerged as the highest-performing product by profit, while Road Bikes generated the highest profit among the product categories. Mountain Bikes and Touring Bikes also contributed significantly to overall profitability.
The branch analysis shows that Ibadan generated the highest profit, substantially outperforming the other branches, while Surulere ranked next among the locations analyzed.
Monthly performance fluctuated throughout the year. Profit remained relatively strong during the first half of the year, declined noticeably around July, and recovered toward the end of the year, with December showing particularly strong performance.
The customer gender distribution was evenly split at 50% male and 50% female, indicating balanced representation within the analyzed sales data.
Product-return analysis revealed that products not meeting customer expectations accounted for the largest proportion of returns (39.58%), followed by wrong products (27.92%), delays (16.69%), and defective products (15.81%). This suggests that improving product expectation management and order accuracy could help reduce the overall rate of returns.
Skills Demonstrated
This project demonstrates my ability to use Microsoft Excel for data cleaning, analysis, PivotTables/PivotCharts, KPI analysis, interactive slicers, dashboard design, data visualization, and business insight generation.
Overall, the dashboard converts sales data into actionable insights that can support management in understanding performance trends, identifying profitable areas of the business, and highlighting opportunities for operational improvement.
Comment (0)
Other projects by Blessing


Talentdigit Resources Limited is a digital training and consulting firm that equips individuals and organizations with digital skills training.


Leave your thought here