
Delloite Sales Summary Dashboard

Project related images. Click to view
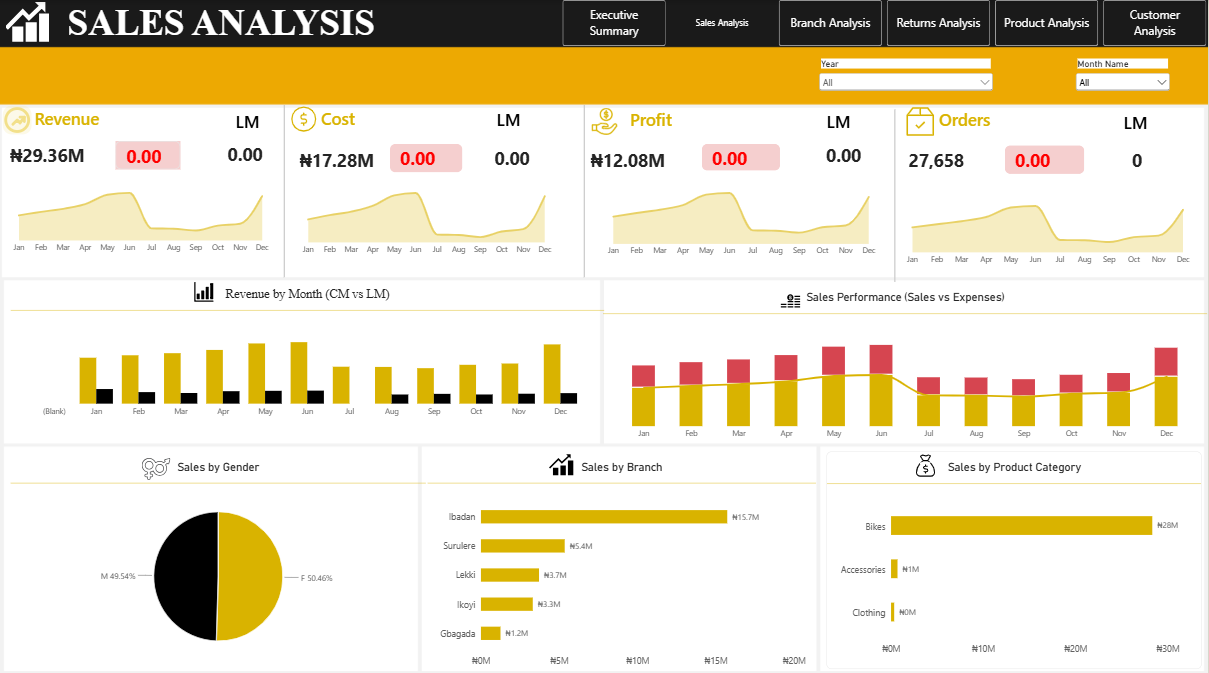
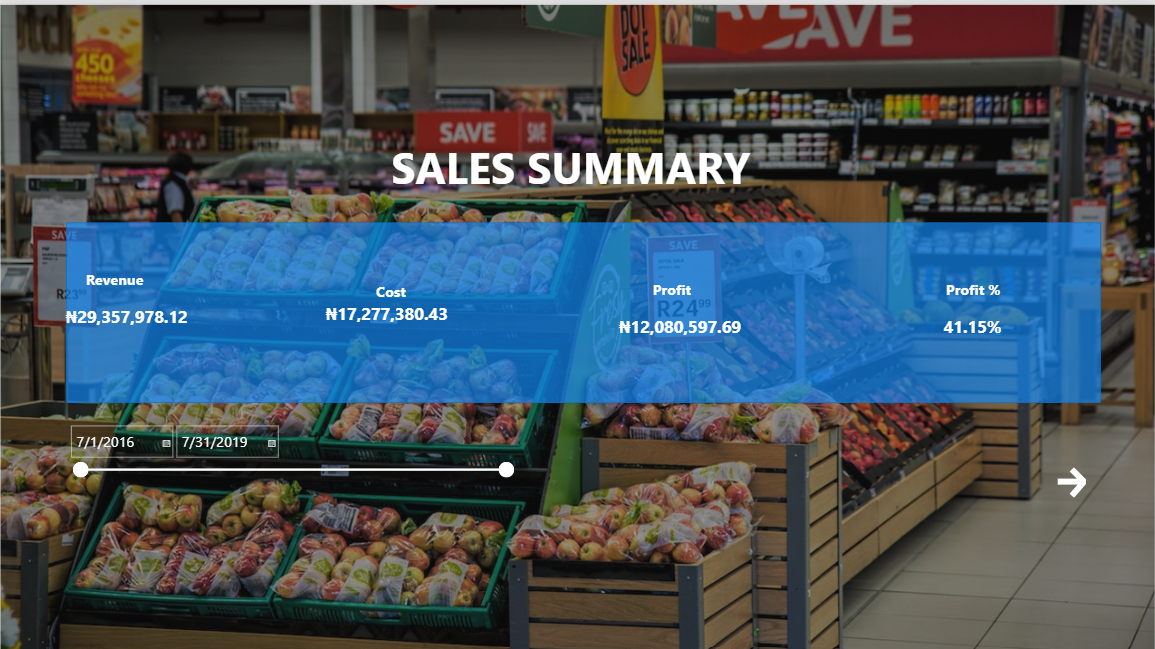
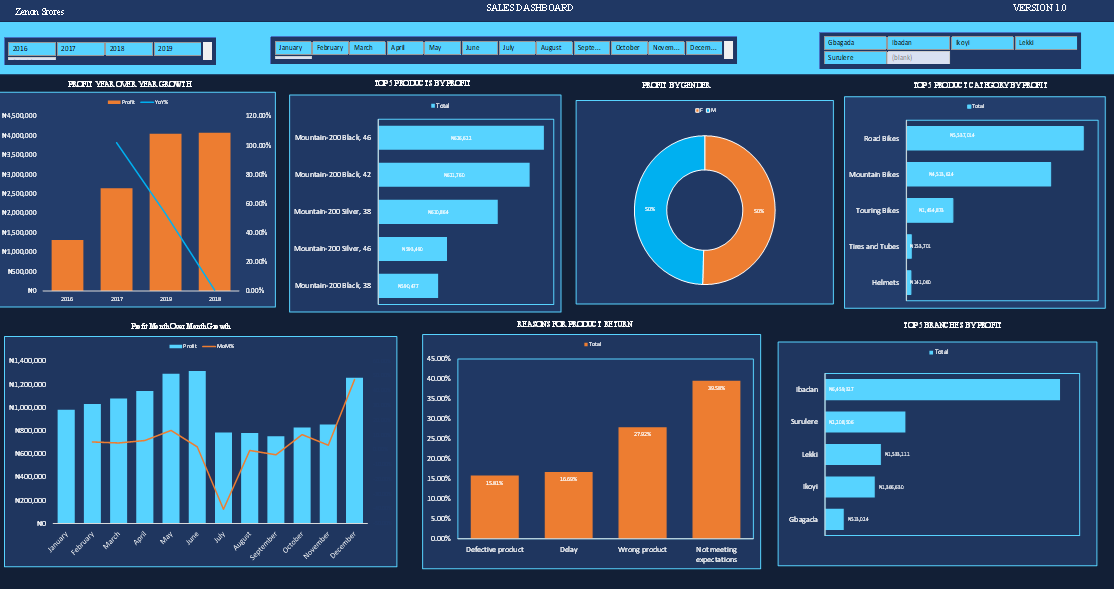
Sales Summary Dashboard – Power BI
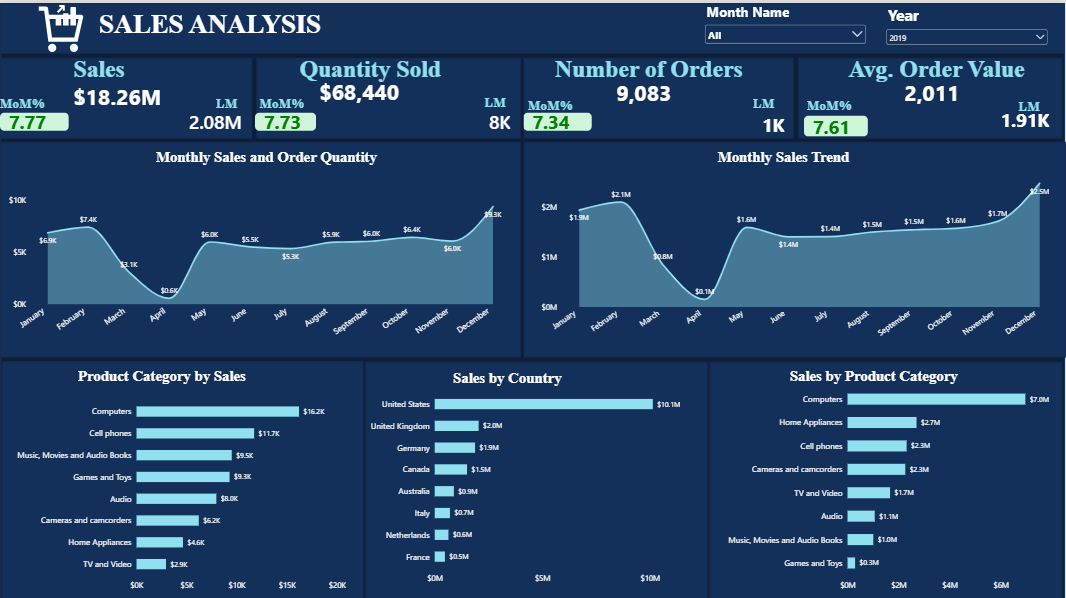
I developed an interactive Sales Summary Dashboard in Power BI to provide a clear overview of business sales performance. I used Power Query for data transformation and table merging, and DAX measures to calculate key metrics including Gross Sales, Discounts, Return Amount, Net Sales, Cost of Sales, Gross Profit, and Gross Margin.
This project demonstrates my ability to clean and transform data, create meaningful business calculations, build data models, and present key sales insights through an interactive and easy-to-understand dashboard.
Comment (0)
Other projects by Blessing

Talentdigit Resources Limited is a digital training and consulting firm that equips individuals and organizations with digital skills training.


Leave your thought here